
Fig. 3.
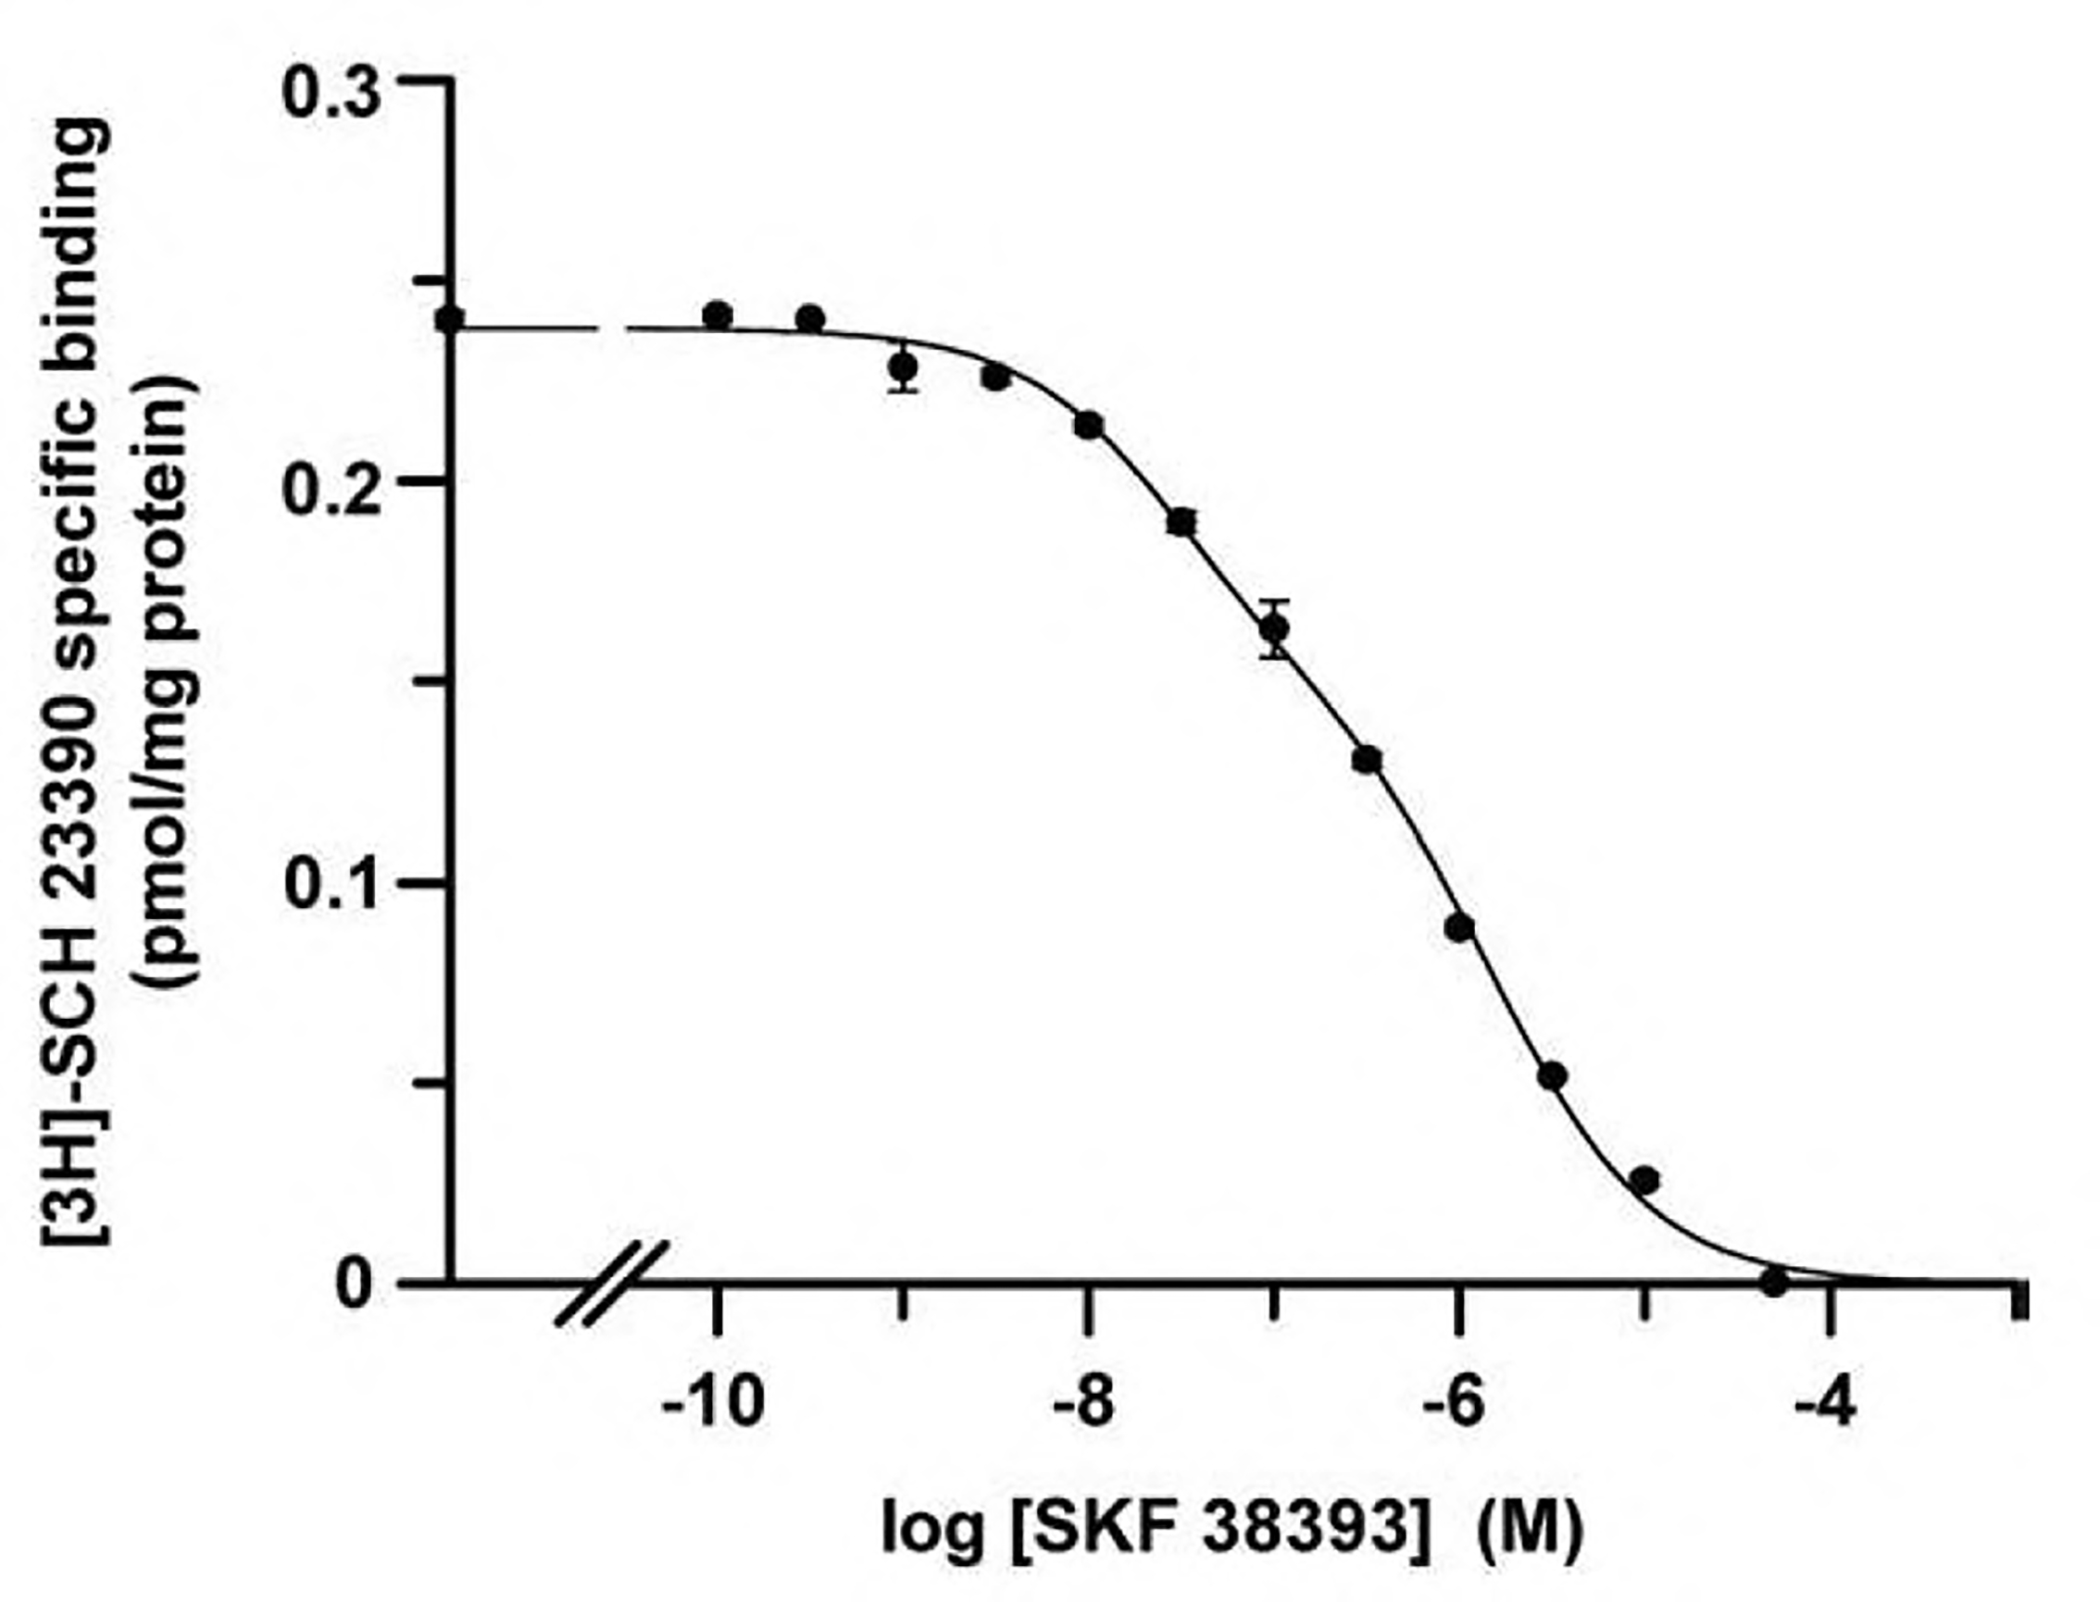
Biphasic competition curves for antagonist versus agonist binding to dopamine D1 receptors. Competition was performed using variable concentrations of non-radiolabeled SKF 38393 (agonist) and 1.2 nM [3H]SCH 23390 (antagonist) in lamb brain striatal membranes (0.5 mg protein/ml) using the protocol described in Ferrada et al., 2009. Data were fitted using equations derived from the two-state dimer receptor model or derived from the assumption of two-affinity (monomeric) states. The two fittings led to indistinguishable curves. The parameter values obtained by non-linear regression are indicated in Table 3.