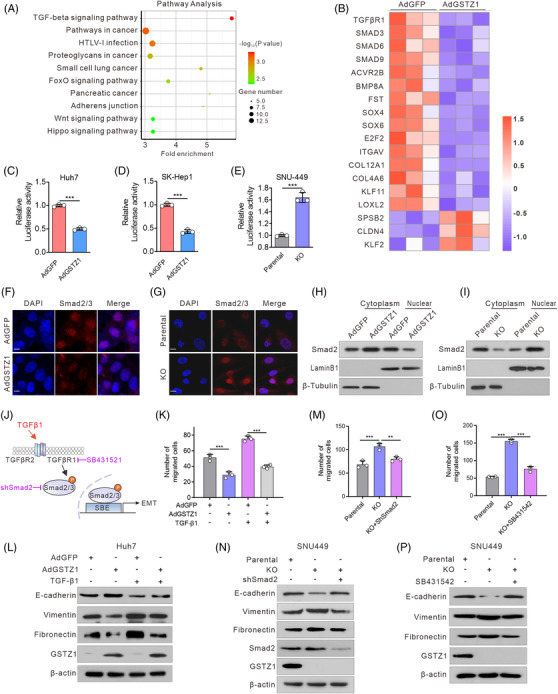
FIGURE 3.

GSTZ1 loss activates transforming growth factor‐β/Smad signalling. (A) RNA sequencing analysis of top 10 significantly down‐regulated Kyoto Encyclopedia of Genes and Genomes (KEGG) pathways between AdGSTZ1‐ and AdGFP‐infected Huh7 cells (n = 3, each). (B) Heatmap of TGFβ/Smad pathway‐related differentially expressed genes (DEGs) identified based on the following criteria: false discovery rate < 0.05 and fold change > 1.5 or < 0.666. (C–E) TGFβ/Smad‐mediated gene transcriptional activities in GSTZ1‐OE (C and D) or ‐KO (E) Hepatocellular carcinoma (HCC) cells as assessed by smad binding element (SBE)‐luciferase assays (n = 3). (F and G) Intracellular localization of Smad2/3 (red) in GSTZ1‐OE Huh7 (F) or GSTZ1‐KO SNU‐449 cells (G). (H and I) Western blot analysis of cytoplasmic and nuclear Smad2/3 protein expression in GSTZ1‐OE Huh7 (H) or GSTZ1‐KO SNU‐449 (I) cells. β‐tubulin and laminB1 served as quality control for cytoplasmic and nuclear fractions, respectively. (J) Model of activation of the TGFβ/Smad pathway. (K and P) Quantification of the migrated cells and immunoblots of the epithelial‐to‐mesenchymal transition (EMT)‐related proteins in GSTZ1‐OE Huh7 cells supplemented with or without TGFβ1 (10 ng/ml, 24 h) (K and L), and GSTZ1‐KO SNU‐449 cells transfected with shSmad2 (M and N) or supplemented with SB431542 (10 μM, 36 h) (O and P). Data are mean ± SD. p‐Values were derived from an unpaired, two‐tailed Student's t‐test in (C–E); one‐way Analysis of Variance (ANOVA) followed by the Tukey test in (K, M, and O) (**p < .01, ***p < .001).
