
FIGURE 5.
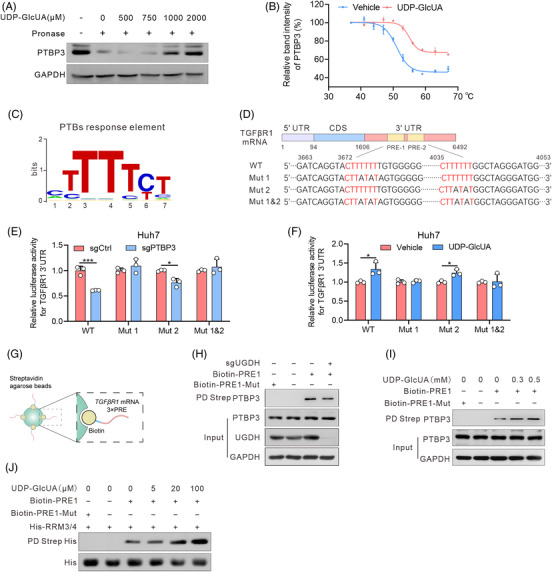
UDP‐GlcUA enhances TGFβR1 mRNA binding of PTBP3. (A) DARTS assays with pronase digestion in Huh7 cells upon UDP‐GlcUA treatment. (B) Cellular thermal shift assay curves for PTBP3 in cell lysates supplemented with or without UDP‐GlcUA. Proteins denatured at the indicated temperature were probed with anti‐PTBP3, with GAPDH as a loading control. The bands were quantified using the Image‐Pro Plus analyzer software and normalized to the protein level of PTBP3 detected at 37°C (n = 3). (C) Conserved consensus PTBP3 response element (PRE). (D) Schematic drawing of two predicted consensus PTB response elements (PREs) in TGFβR1 mRNA 3′‐UTR. WT for wild‐type, Mut 1 for PRE1 mutation, Mut 2 for PRE2 mutation, Mut 1 and Mut 2 for combo mutation. (E) Relative luciferase activities in Huh7 cells with or without PTBP3 depletion (n = 3 independent experiments). (F) Relative luciferase activities in Huh7 cells transfected with 3′‐UTR segments containing wild type (WT) or PRE‐1/2 mutants upon UDP‐GlcUA supplementation. (G–I) Streptavidin agarose affinity pull‐down assay using biotin‐PRE1 as a probe (G) in Huh7 cells with UDP‐glucose 6‐dehydrogenase (UGDH) depletion (H) or supplemented with UDP‐GlcUA (I). PRE1‐Mut served as a negative control. (J) Streptavidin agarose affinity pull‐down assay using biotin‐PREs (1 μg) as a probe by mixing purified recombinant His‐RRM3/4 (5 μg) and increasing doses of UDP‐GlcUA. Data are mean ± SD. p‐Values were derived from an unpaired, two‐tailed Student's t‐test in (B and E–F) (*p < .01, ***p < .001).