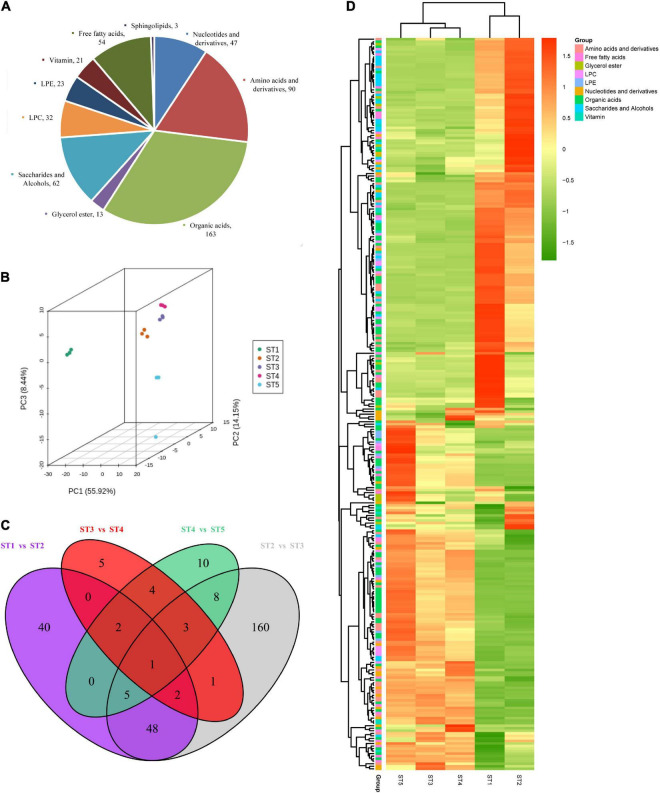
FIGURE 2.
The metabolomics data of the jujube fruit at different stages. (A) Pie chart of primary metabolites identified in jujube fruits. (B) PCA analysis of the jujube fruit samples. (C) Venn diagram showing the differential accumulated metabolites (DAMs) of comparison groups. (D) Heatmap of 228 differentially accumulated metabolites (DAMs). Different colors in the heat map represent the values obtained by normalizing the relative content of differential metabolites, reflecting their relative content (the color bar from green to red represents low content to high content), and the annotation bar on the right side of the clustering tree corresponds to the secondary substance of Class II.

