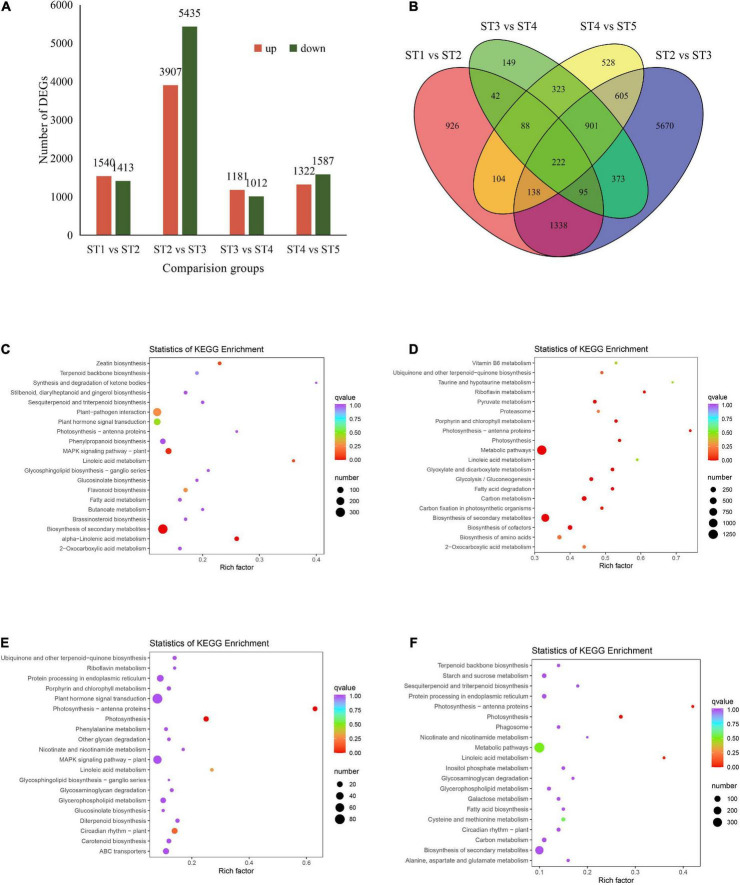
FIGURE 3.
DEGs involved in jujube fruit at different developmental stages. (A) Number of DEGs identified in comparison groups. (B) Venn diagram of DEGs in four comparison groups. (C–F) Represents KEGG enrichments in each pairwise comparison, respectively. The vertical coordinate represented the corresponding rich factor for each pathway, the horizontal ordinate represents the name of the pathway, the color of the dots reflects the p-value, and the redder the more significant the enrichment. The size of the dots represents the number of enriched differential genes.

