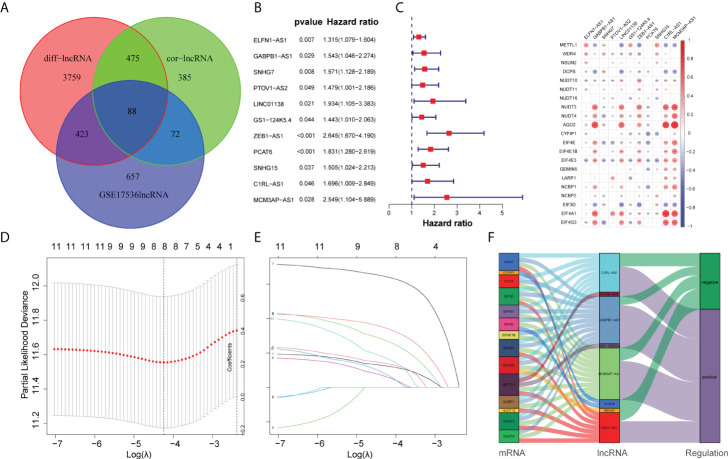
Figure 3.
Construction of the prognostic m7G-related lncRNAs risk model. (A) Venn diagram of cor-lncRNA, diff-lncRNA, and GSE17536lncRNA. (B) Forest map of 11 prognostic m7G-related lncRNAs by univariate Cox analysis (P < 0.05). (C) The correlation between 21 differentially expressed m7G-related genes and 11 prognostic m7G-related lncRNAs. The red color represents a positive correlation; the blue color represents a negative correlation. *P < 0.05, **P < 0.01, and ***P < 0.001. (D) 1,000 cross-validation to determine the optimal penalty parameter lambda (λ). (E) Lasso regression of the 11 m7G-related lncRNAs. (F) The Sankey diagram displayed the relationship between the m7G regulators mRNA expression and the m7G-related lncRNAs.

