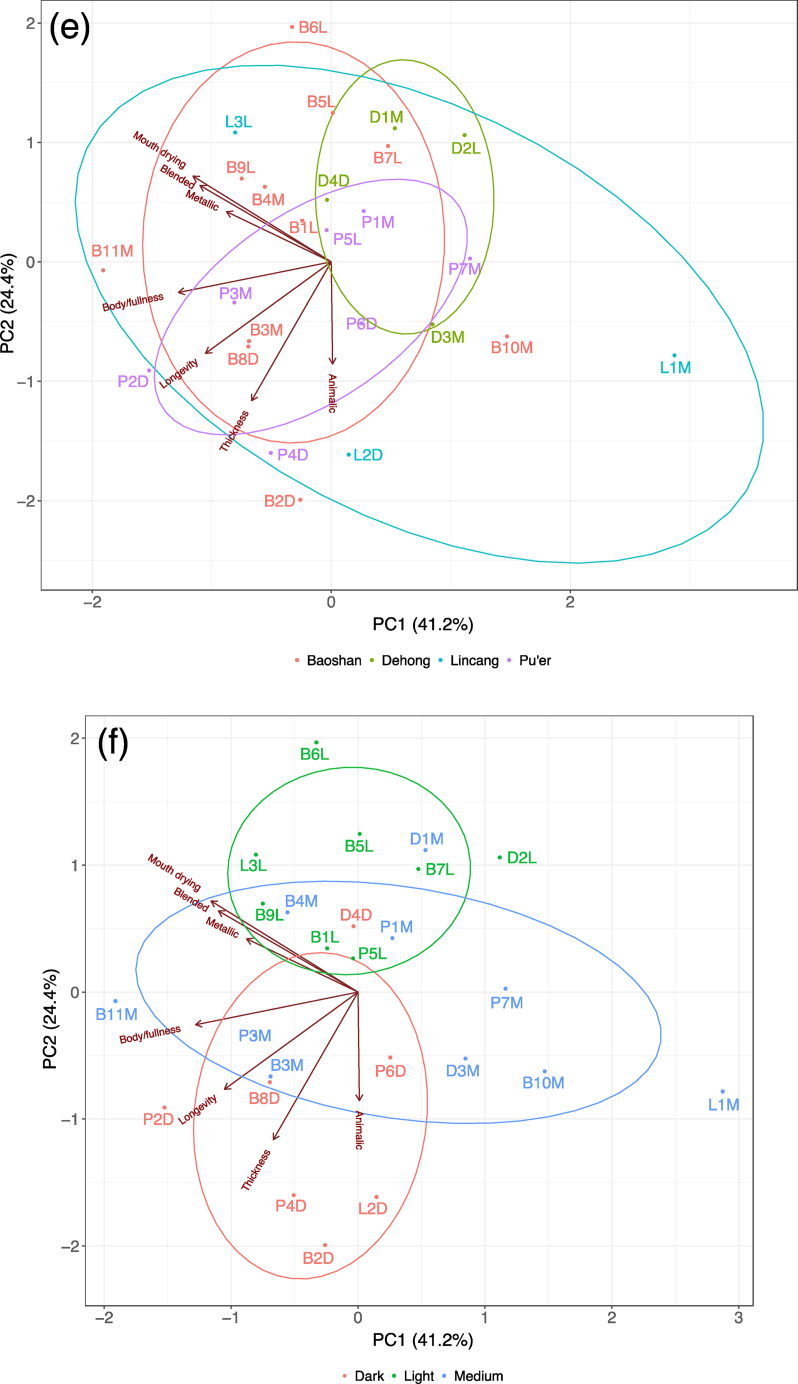
Fig. 3.
PCA plots showing the positioning of the 39 “flavor” attributes [(a) and (b)], 11 “taste” attributes [(c) and (d)], and 7 “others” attributes [(e) and (f)] and the 20 Yunnan coffee samples (see Table 1 for labels). In (a), (c), and (d), the coffee samples are grouped according to the growing area, and in (b), (d), and (e), the coffee samples are grouped according to the degree of roasting.


