Fig. 3.
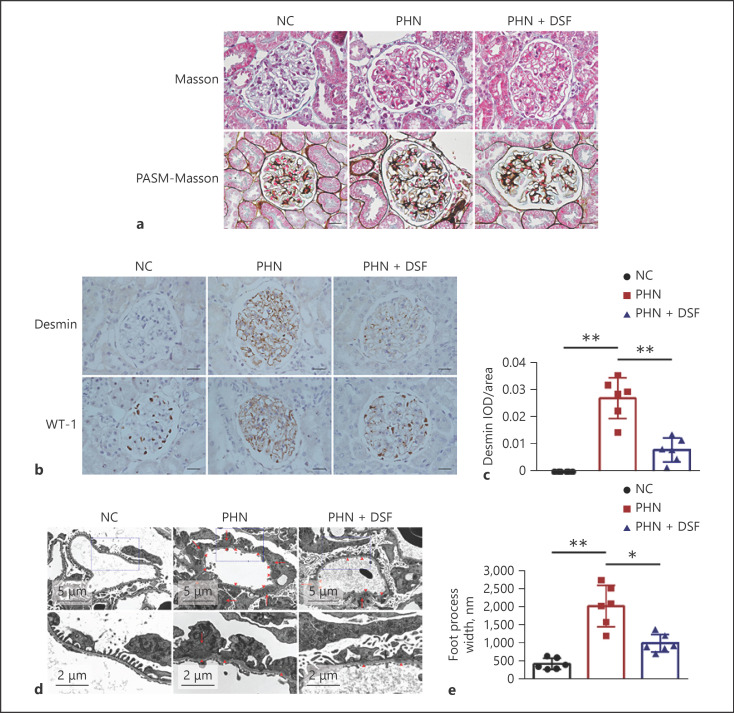
DSF ameliorated glomerular podocyte injury in PHN rats. a Representative renal Masson and PASM-Masson staining of the rats (n = 6) in each group; Scale bars = 20 μm. b, c Representative renal immunohistochemical staining of Desmin and WT-1 (b) and semiquantification based on the glomerular IOD/area of Desmin (c) of the rats (n = 6) in each group; Scale bars = 20 μm. d, e Representative glomerular transmission electron microscopy images (d) and podocyte foot process width (e) of the rats (n = 6) in each group. Arrowheads, subepithelial dense deposit; arrows, podocyte foot process fusion. The data above are shown as the mean ± SD. ANOVA with LSD-t test (equal variances assumed) or Welch's test with Dunnett's T3 test (equal variances not assumed) was used for multiple comparisons among groups. *, p < 0.05; **, p < 0.01.

