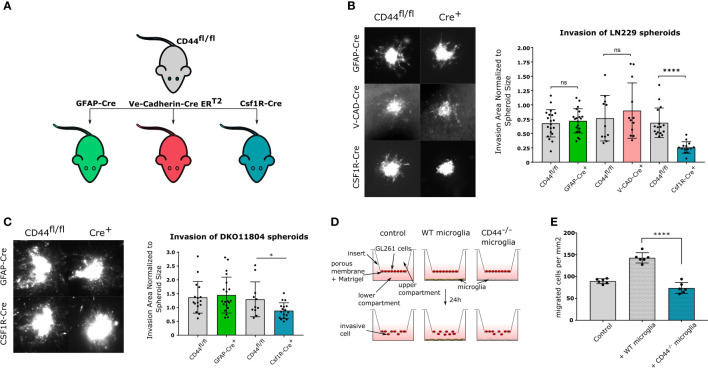
Figure 2.
CD44 in myeloid cells stimulates glioma invasion (A) Schematic representation of mouse lines used in the study. CD44fl/fl mice were crossed with three different Cre-bearing mouse lines in order to generate conditional knock-out models. In CD44fl/fl × GFAP-Cre mice, CD44 is specifically deleted in astrocytes; in CD44fl/fl × Ve-Cadherin CreERT2 mice, upon tamoxifen treatment CD44 is specifically deleted in endothelial cells; and in CD44fl/fl × Csf1R-Cre mice, CD44 is specifically deleted in myeloid cells. (B) Ex-vivo invasion assay on LN229 spheroids implanted in brain slices from the three cKO mouse models. CD44fl/fl mice were used as controls. Representative images of DiD labeled LN229 spheroids 48 hours after implantation are shown on the left. Corresponding quantification is shown on the right. Bar charts represent the invasion area of a spheroid normalized to the area of its mass. Data are presented as mean ± SD. Student’s t-Test, ****p < 0.0001; n.s. = not-significant. (C) Ex-vivo invasion assay on DKO11804 primary mouse glioma cells implanted in brain slices from CD44fl/fl, CD44fl/fl×GFAP-Cre and CD44fl/fl×Csf1R-Cre mice. Representative images of DiD labeled DKO11804 spheroids 48 hours after implantation are shown on the left. Corresponding quantification is shown on the right. Bar charts represent the invasion area of a spheroid normalized to the area of its mass. Data are presented as mean ± SD. Student’s t-Test, *p < 0.05. (D) Schematic representation of the Boyden assay. (E) Quantification of migrating GL261 cells. Bar charts represent the number of transmigrating cells per mm2. One-way ANOVA with the Tukey’s multiple comparisons test, ****p < 0.0001.

