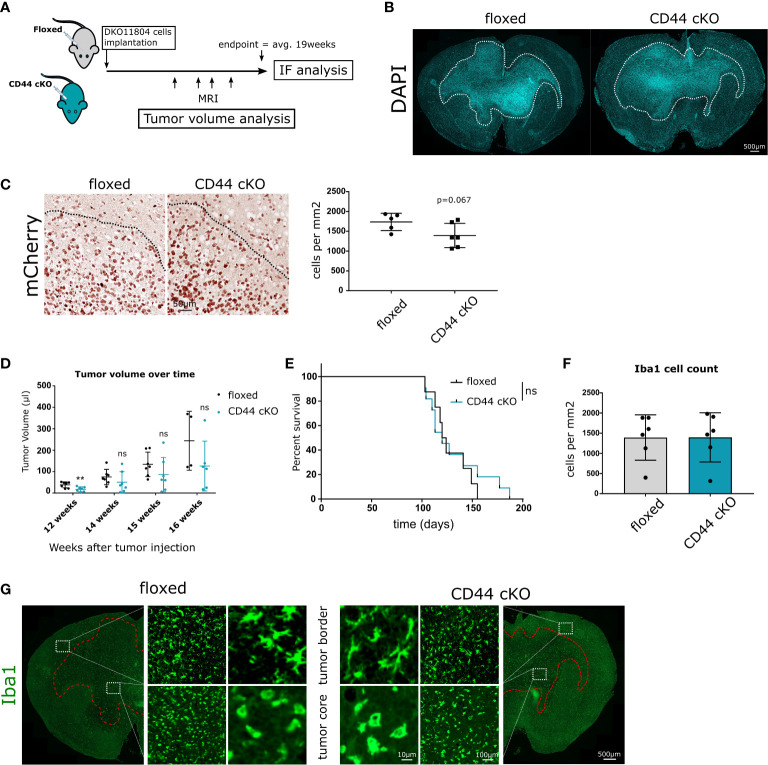
Figure 3.
Effects of Myeloid-specific CD44 knock-out in vivo. (A) 1 × 10⁶ DKO11804 mCherry labelled cells were implanted in 5-8 weeks old floxed or CD44 cKO mice. MRI imaging was performed at weeks 12, 14, 15 and 16 after tumor cells implantation. Animals were sacrificed at endpoint, on average 19 weeks after injection and IF/IHC Analysis were performed. (B) Representative images of brains from floxed and CD44 cKO tumor-bearing mice stained with DAPI. Dashed line delimits tumor and shows invasive growth pattern. (C) Left-Representative images of tumors stained with mCherry. Dashed lines delimit the tumor core. Right-Quantification of the number of mCherry-positive tumor cells migrating beyond the tumor border. The tumor border was manually drawn and the number of cancer mCherry-positive cells spreading in a radius of 300 microns was counted. Data are presented as mean ± SD. Student’s t-Test, p=0.067. (D) Tumor growth was monitored with MRI. Graphs represent tumor volume (μl) for individual mice calculate from T2- weighted images.” by “Graphs represent tumor volume (μl) for individual mice calculated from T2-weighted images. Data are presented as mean ± SD. Student’s t-Test, ** p < 0.01; n.s. = not-significant. (E) Kaplan-Meier plot of survival for floxed (n=11) and cKO (n=8) mice transplanted with 1 × 10⁶ DKO11804. Time = days. Log-rank (Mantel-Cox) test, n.s. = not-significant. (F–G) Myeloid cells recruitment and morphology at endpoint. (F) Bar charts depict the number of Iba1 positive cells per mm2 in the tumor core. Student’s t-Test. (G) Representative images of Iba1- positive cells. At the tumor border, labelled cells present with ramified morphology, whereas within the tumor core their morphology is amoeboid.

