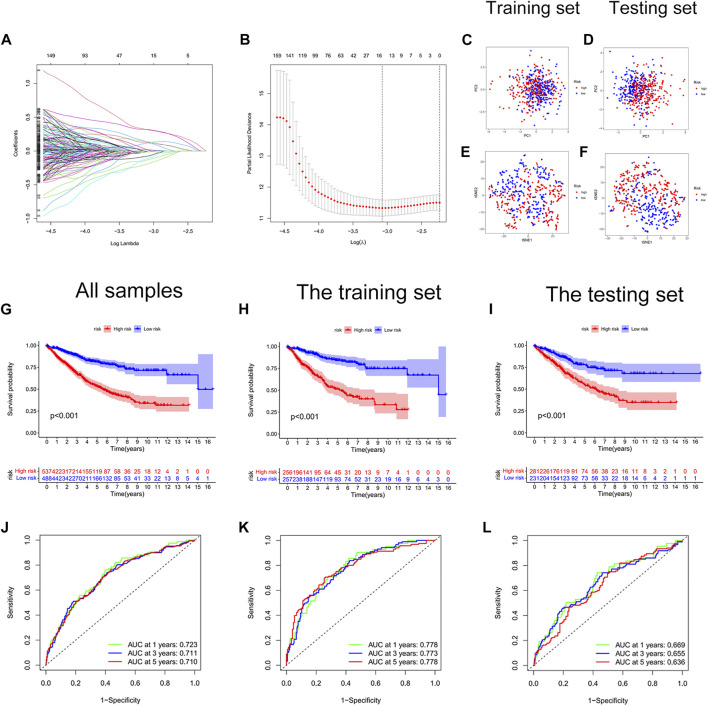
FIGURE 3.
Construction of a cellular senescence-related risk score signature. (A) LASSO regression analysis. (B) Cross-validation for tuning the parameter selection. (C) The PCA plot of the training set. (D) The PCA plot of the test set. (E) The t-SEN plot of the training set. (F) The t-SEN plot of the testing set. (G) The K-M survival curve of all colon cancer samples, p < 0.001. (H) The K-M survival curve of the training set, p < 0.001. (I) The Kaplan-Meier survival curve of the testing set, p < 0.001. (J) The AUC values of 1-year, 3-years, and 5-years survival for all colon cancer patients were more than 0.700. (K) The AUC values of 1-year, 3-years, and 5-years survival for the training set were more than 0.750. (L) The AUC values of 1-year, 3-years, and 5-years survival for the testing set were more than 0.600.

