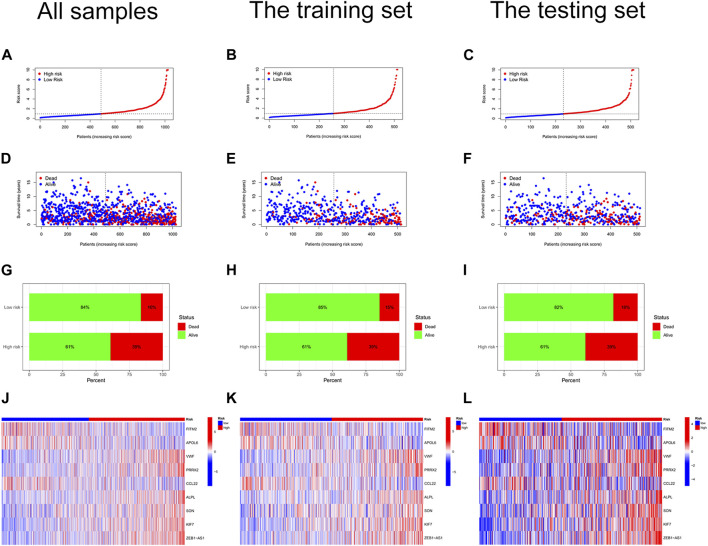
FIGURE 4.
Risk curves. (A) Risk status plot of all colon cancer samples. The horizontal coordinate represented the ranked patients, and the risk scores of patients gradually increased from left to right; the vertical coordinate represented the risk scores. (B) Risk status of the training set. (C) Risk status of the testing set. (D) Survival status plot of all colon cancer samples. (E) Survival status plot of the training set. (F) Survival status plot of the testing set. (G) Risk histogram of all colon cancer samples. The percentage of survival patients in the low-risk score group was higher than that in the high-risk score group. (H) Risk histogram of the training set. (I) Risk histogram of the testing set. (J) Risk heat map of all colon cancer samples. The expression of FITM2, APOL6, and CCL22 decreased with increasing risk scores; the expression of VWF, PRRX2, ALPL, SON, KIF7, and ZEB1-AS1 increased with increasing risk scores. (K) Risk heat map of the training set. (L) Risk heat map of the testing set.

