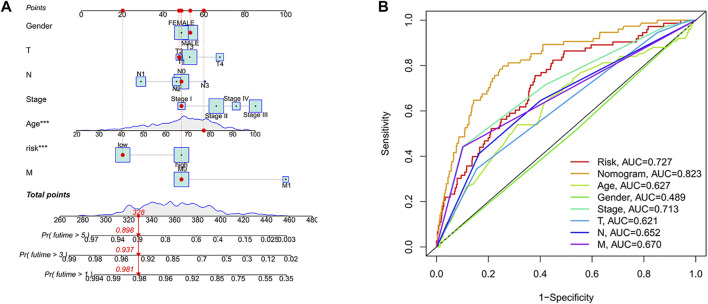
FIGURE 6.
Developing a Nomogram. (A) Nomogram. When the total point was 328, the nomogram predicted that the 1-year survival probability of patients was more than 0.981, the 3-years survival probability was more than 0.937, and the 5-years survival probability was more than 0.898. (B) Nomogram ROC curve. The horizontal coordinate represented the false-positive rate expressed by 1-Specificity and the vertical coordinate represented the true-positive rate expressed by sensitivity.

