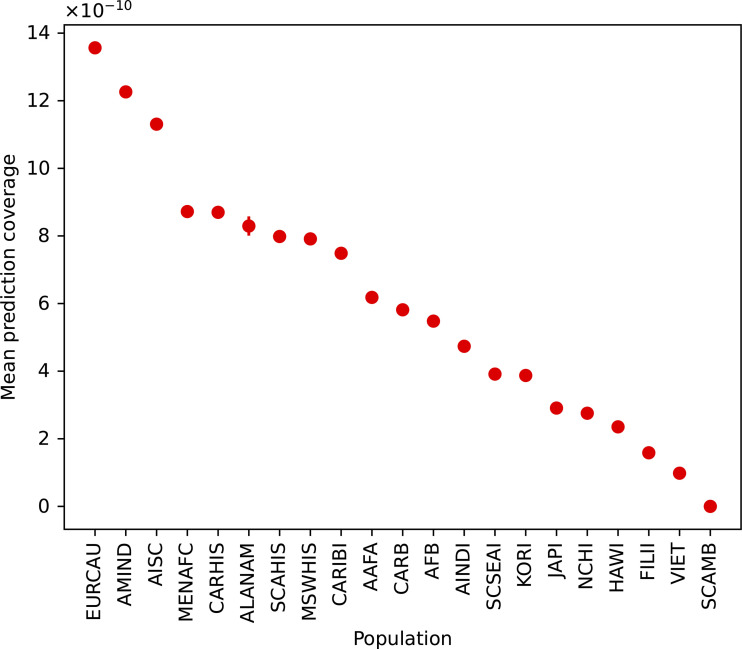
Figure 1.
Disparities in the accurate coverage of computational antigen predictions for diverse HLA-I populations. The mean fraction of a population that is covered by the NetMHC 4.0 software is plotted for diverse population groups. The mean and 95% confidence interval are denoted. The population groups are derived from the National Marrow Donor Program (Gragert et al., 2013). All HLA-I haplotypes constructed from the HLA-I molecules covered by the NetMHC 4.0 software were simulated and population frequencies inferred (Hoyos et al., 2022).

