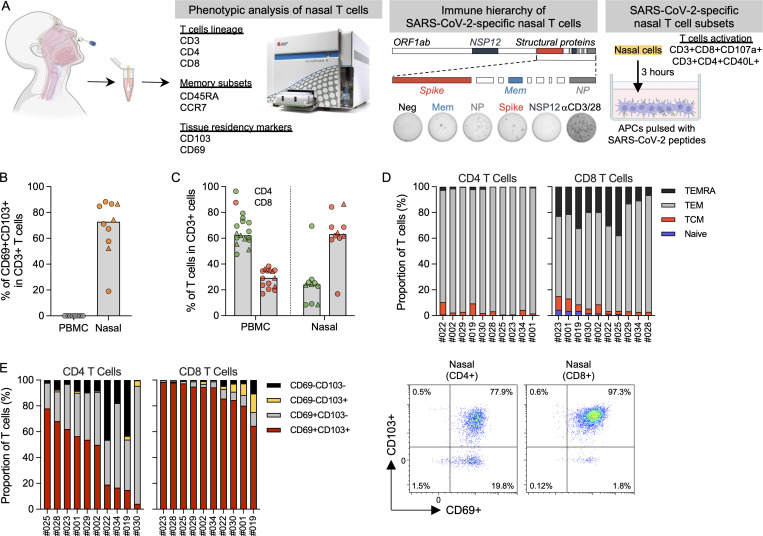
Figure 1.
Phenotypic analysis of T cells in nasal secretion. (A) Schematic of experimental design. (B) Frequency of tissue-resident T cells present in PBMCs (n = 8) and nasal secretion (n = 10). Convalescent vaccinees are indicated by a triangle symbol. (C) Frequency of CD4 and CD8 T cells present in PBMCs (n = 14) or nasal cells (n = 10). Convalescent vaccinees are indicated by a triangle. (D) Proportion of naive (CCR7+CD45RA+), central (CCR7+CD45RA−; TCM), effector (CCR7−CD45RA−; TEM) and terminally differentiated (CCR7−CD45RA+; TEMRA) memory CD4+ and CD8+ nasal T cells (n = 10). (E) Proportion of tissue-resident marker (CD69 and CD103) expression on CD8 and CD4 nasal T cells (n = 10) and corresponding representative plots.

