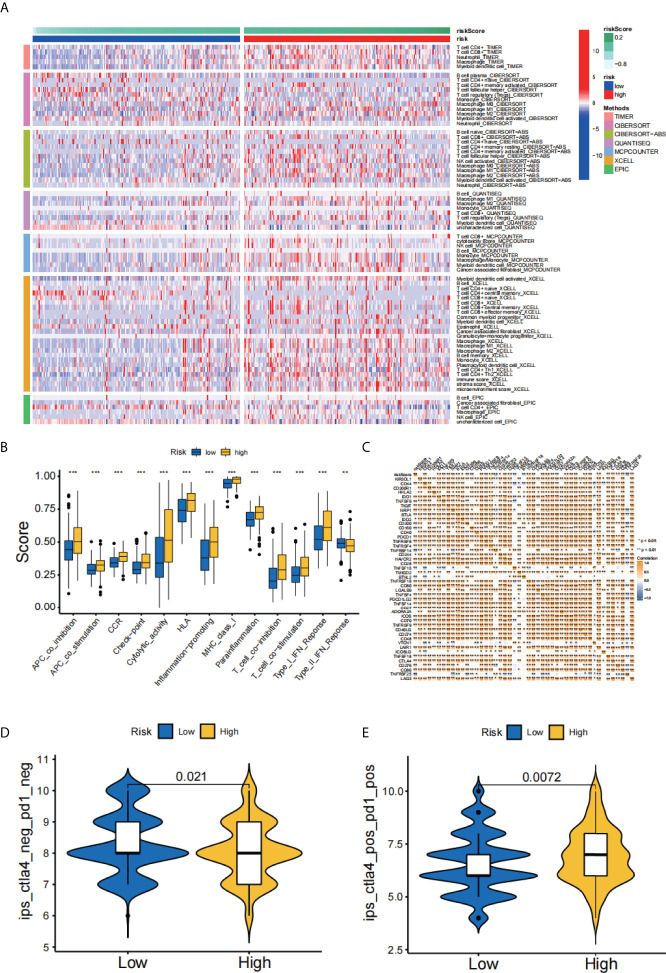
Figure 8.
Analysis of immune landscape. (A) A heatmap for immunological responses between high- and low-risk groups. (B) Immune cell subpopulations and associated functions. (C) Expression of immune checkpoints in high- and low-risk cohorts. (D, E) Relative response of anti-PD-1 and anti-CTLA4 therapy between two groups. **p < 0.01; ***p < 0.001.

