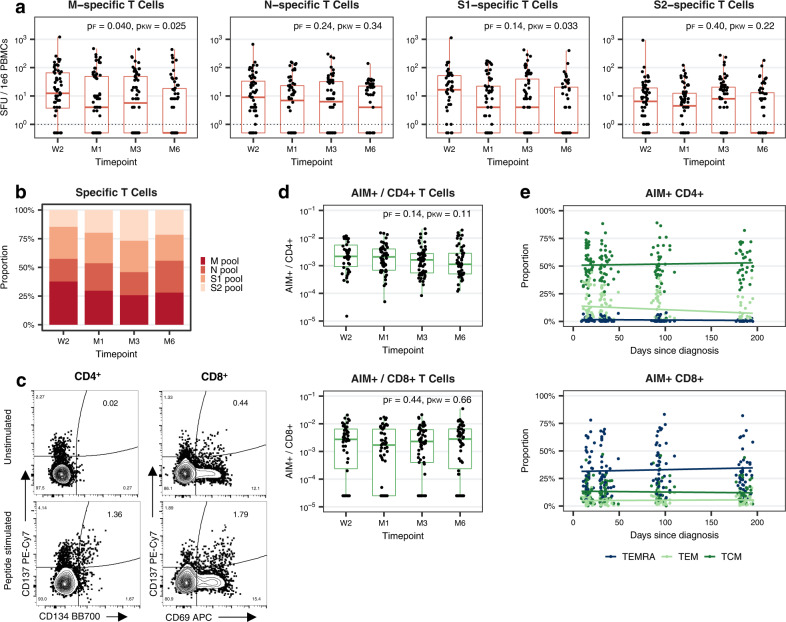
Fig. 4. T cell responses specific to SARS-CoV-2 M, N, S1, and S2 epitope pools over time.
a Number of spot-forming units (SFU) per 1e6 peripheral blood mononuclear cells (PBMCs) following stimulation with M, N, S1, or S2 overlapping peptide pools at indicated timepoints post-diagnosis within the subsample of individuals undergoing detailed testing (total n = 64; W2: n = 56, M1: n = 64, M3: n = 64, M6: n = 55). Boxplots represent the median and interquartile range (IQR; whiskers: 1.5 × IQR). Dotted lines indicate the limit of detection cutoff (SFU values greater than 0). Statistical testing was performed using two-sided Friedman and two-sided Kruskal–Wallis tests to account for both repeated testing and missing data (n = 48 with complete follow-up data). pF: p-value based on Friedman test, pKW: p-value based on Kruskal–Wallis test, W2: two weeks, M1: one month, M3: three months, M6: six months after diagnosis. b Fraction of the pooled T cell response (summed M, N, S1, and S2 SFU values) specific for each peptide pool at indicated timepoints post-diagnosis. c Representative flow cytometry plots depicting AIM+ (CD134+CD137+) CD4+ (left) and AIM+ (CD69+CD137+) CD8+ (right) T cell populations in unstimulated (top) or SARS-CoV-2 megapool peptide-stimulated (bottom) PBMCs. d AIM+ cells as a fraction of CD4+ or CD8+ T cells at indicated timepoints post-diagnosis within the subsample of individuals undergoing detailed testing (total n = 64; W2: n = 46, M1: n = 53, M3: n = 62, M6: n = 54). Boxplots represent median and IQR (whiskers: 1.5 × IQR). Statistical testing was performed using two-sided Friedman (n = 35 with complete follow-up data) and two-sided Kruskal–Wallis tests. e Percentage of AIM+CD4+ and AIM+CD8+ T cells with TCM (CD45RA–CCR7+), TEM (CD45RA–CCR7–) or TEMRA (CD45RA+CCR7–) phenotypes by day post-diagnosis. Lines represent trends over time based on unadjusted linear regression models. Source data are provided as a Source Data file.

