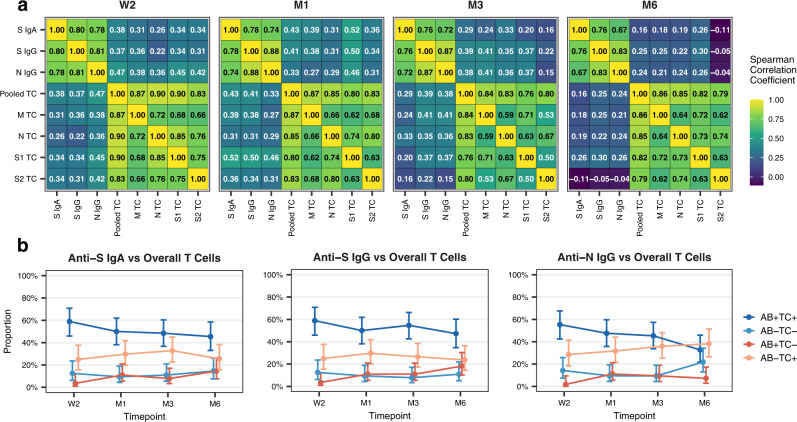
Fig. 5. Relationship between antibody and T cell responses over time.
a Heatmaps demonstrating the correlation between anti-S IgA, anti-S IgG, and anti-N IgG levels (as mean fluorescence intensity (MFI) ratios) and M, N, S1, and S2 epitope pool-specific T cells (as spot-forming units (SFU) per 1e6 peripheral blood mononuclear cells (PBMCs)) or pooled T cells (summed M, N, S1, and S2 values) at indicated timepoints. Numbers in individual cells correspond to respective Spearman correlation coefficients. TC: T cell, W2: two weeks, M1: one month, M3: three months, M6: six months after diagnosis. b Proportion of participants with concordant and discordant results between testing positive (detectable response) or negative (no detectable response) for anti-S IgA, anti-S IgG, and anti-N IgG antibody subtypes (i.e., MFI ratio values above or below the limits of detection of 6.5 for IgA and 6.0 for IgG) and between being positive or negative for overall T cell responses (i.e., detectable SFU to at least one peptide pool) over time. Points and error bars represent estimated proportions with associated 95% Wilson confidence intervals. AB: Antibody. Source data are provided as a Source Data file.

