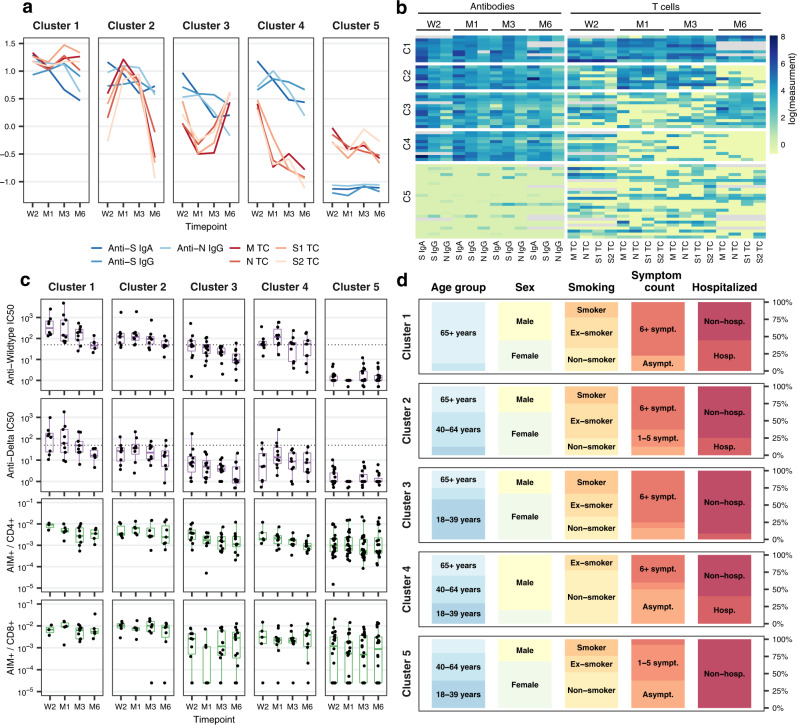
Fig. 6. Clustering of antibody and T cell response trajectories.
a Average mean fluorescence intensity (MFI) ratios of anti-S IgA, anti-S IgG, and anti-N IgG antibodies and mean M, N, S1, and S2 epitope pool-specific T cells (spot-forming units (SFU) per 1e6 peripheral blood mononuclear cells (PBMCs)) in each of the five clusters over time (total n = 64; cluster 1: n = 9, cluster 2: n = 8, cluster 3: n = 12, cluster 4: n = 10, cluster 5: n = 25). Displayed data was natural logarithm-transformed and normalized (rescaled). W2: two weeks, M1: one month, M3: three months, M6: six months after diagnosis. b Heatmap showing anti-S IgA, anti-S IgG, and anti-N IgG MFI ratios and M, N, S1, and S2 epitope pool-specific SFU/1e6 PBMCs for all participants belonging to the five identified clusters. Gray color indicates missing values, displayed data corresponds to natural logarithm-transformed measured data. C1–5: cluster 1 to 5. c Anti-Wildtype SARS-CoV-2 neutralizing antibody half maximal inhibitory concentration (IC50), anti-Delta SARS-CoV-2 neutralizing antibody IC50, frequency of AIM+CD4+ and AIM+CD8+ T cells in the five clusters over time. Boxplots represent the median and interquartile range (IQR; whiskers: 1.5*IQR). Dotted lines indicate limit of detection cutoffs (50 for IC50 for neutralizing activity). d Distribution of participant characteristics within the five clusters according to age group (18–39 years, 40–64 years, ≥65 years), sex (male and female), smoking status (non-smoker, ex-smoker, smoker), number of symptoms reported (asymptomatic, 1–5 symptoms, ≥6 symptoms), and hospitalization status (non-hospitalized, hospitalized) during acute infection. Asympt.: asymptomatic, sympt.: symptoms, hosp.: hospitalized. Source data are provided as a Source Data file.

