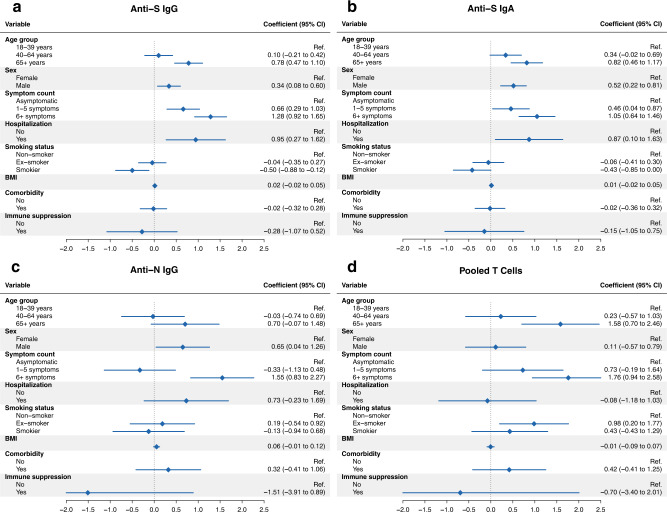
Fig. 7. Association analyses of antibody and T cell responses.
a Forest plot demonstrating results from adjusted mixed linear regression analyses evaluating the associations of anti-S IgG mean fluorescence intensity (MFI) ratios with demographic and clinical factors (age, sex, COVID-19 symptom count, smoking status, body mass index, presence of at least one comorbidity and immunosuppression) in the overall study population (total n = 431). The model was adjusted for time since diagnosis, age group, sex, and disease severity expressed as symptom count, with a random intercept for each individual. Points and error bars in panels a–d represent estimated coefficients with associated 95% confidence intervals (CIs). BMI: body mass index. b Forest plot showing results from adjusted mixed linear regression analyses evaluating the associations of anti-S IgA MFI ratios with demographic and clinical factors in the overall study population. Model adjustment as for panel a. c Forest plot showing results from adjusted mixed linear regression analyses evaluating the associations of anti-N IgG MFI ratios with demographic and clinical factors in the subsample (total n = 64). Model adjustment as for panel a. d Forest plot demonstrating results from adjusted mixed linear regression analyses evaluating the associations of pooled T cells (summed M, N, S1, and S2 spot-forming units (SFU) per 1e6 peripheral blood mononuclear cells (PBMCs)) with demographic and clinical factors in the subsample. Model adjustment as for panel a. Source data are provided as a Source Data file.

