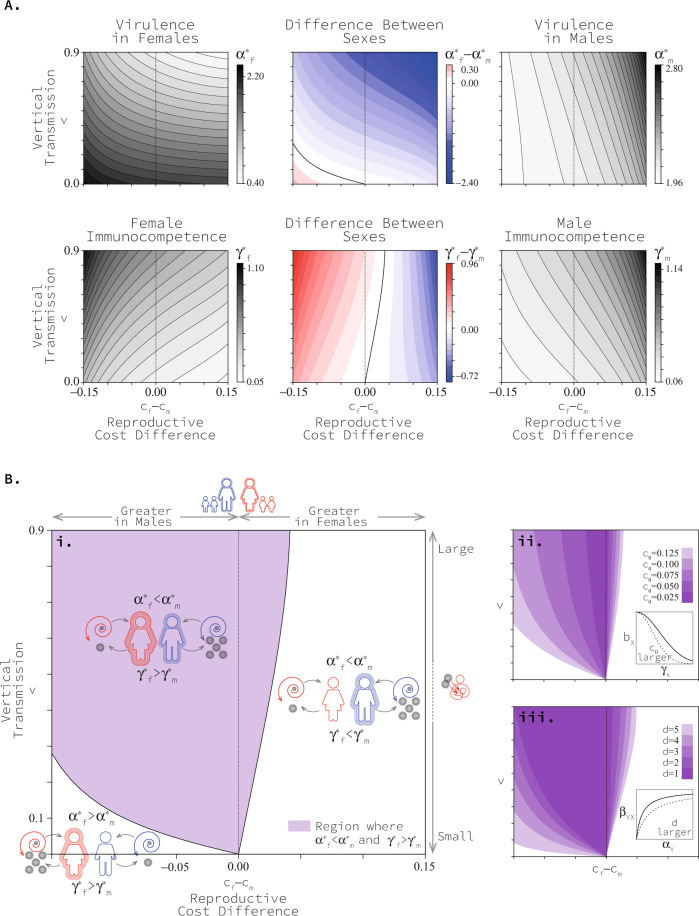
Fig. 4. Co-evolved levels of virulence and immunocompetence in each sex as vertical transmission and difference in the cost of immune function changes.
In panel A black and white sub-panels present the virulence and immunocompetence levels in each of the sexes, while coloured centre sub-panels present the virulence and immunocompetence of the sexes relative to each other. In these sub-panels red areas correspond to greater values in females and blue areas correspond to greater values in males. Black curves in centre sub-panels correspond to zero differences between the sexes and separate red regions from blue ones. Panel B.i combines the black curves in panel (A) centre sub-panels to define three regions corresponding to the three qualitatively different co-evolutionary patterns. Panels B.ii, iii show how these regions change as parameter values affecting the trade-off in host c0 and pathogen d change. Results are based on c0 = 0.1, bmax = 2, βmax = 1.1, d = 4 and μ = 0.1. See Methods for an explanation of model parameters. Source data are provided as a Source Data file.

