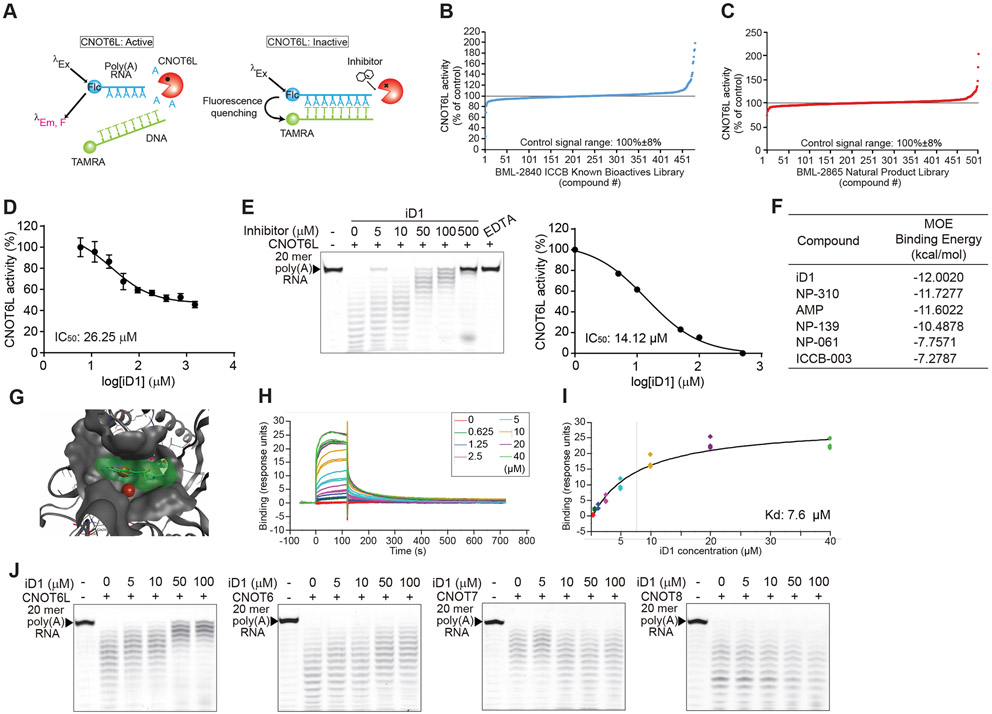
Figure 1. Identification of the CNOT6L inhibitor.
(A) Schematic diagram of FRET-based deadenylase assay. When CNOT6L activity was suppressed by a compound, 6-FAM fluorescence of the intact substrate was quenched upon probe hybridization because of the proximity of the TAMRA fluorophore.
(B and C) FRET-based HTS for CNOT6L inhibitor candidates from two compound libraries, BML-2840 ICCB Known Bioactives Library (B) and BML-2865 Natural Product Library (C).
(D) FRET-based deadenylase assay showing the dose-dependent inhibition curve of CNOT6L activity with iD1. CNOT6L protein and iD1 at the indicated concentration were incubated with 6-FAM-poly(A)12 RNA and TAMRA-oligo(dT) DNA. Fluorescence intensity was measured to calculate IC50 of iD1. n = 3 per group.
(E) Gel-based deadenylase assay of CNOT6L with iD1. 2.5 μM of CNOT6L protein and iD1 at the indicated concentration were incubated with 5’-FITC-poly(A)20 RNA. Labeled RNAs were visualized on a denaturing sequencing gel (left). The dose-dependent inhibition curve of CNOT6L activity with iD1 was calculated from the left panel (right). EDTA was used as a positive control.
(F) List of the binding energy of the indicated compounds with CNOT6L. Binding energy was calculated in the MOE software.
(G) The docking model of iD1 to a cleft of the CNOT6L deadenylase domain. The docking model of the active-site pocket of CNOT6L (PDB: 3NGO) (grey) with iD1 (green) and Mg2+ (red) was built in the MOE software.
(H and I) The normalized steady-state affinity curve showing the binding of iD1 to CNOT6L protein on the sensor chip surface. Serial dilutions of iD1 were used to calculate Kd = 7.6 μM.
(J) Gel-based deadenylase assay of the indicated deadenylase with iD1. CNOT6L, CNOT6, CNOT7, or CNOT8 protein and iD1 at the indicated concentration were incubated with 5’-FITC-poly(A)20 RNA.
See also Figures S1.

