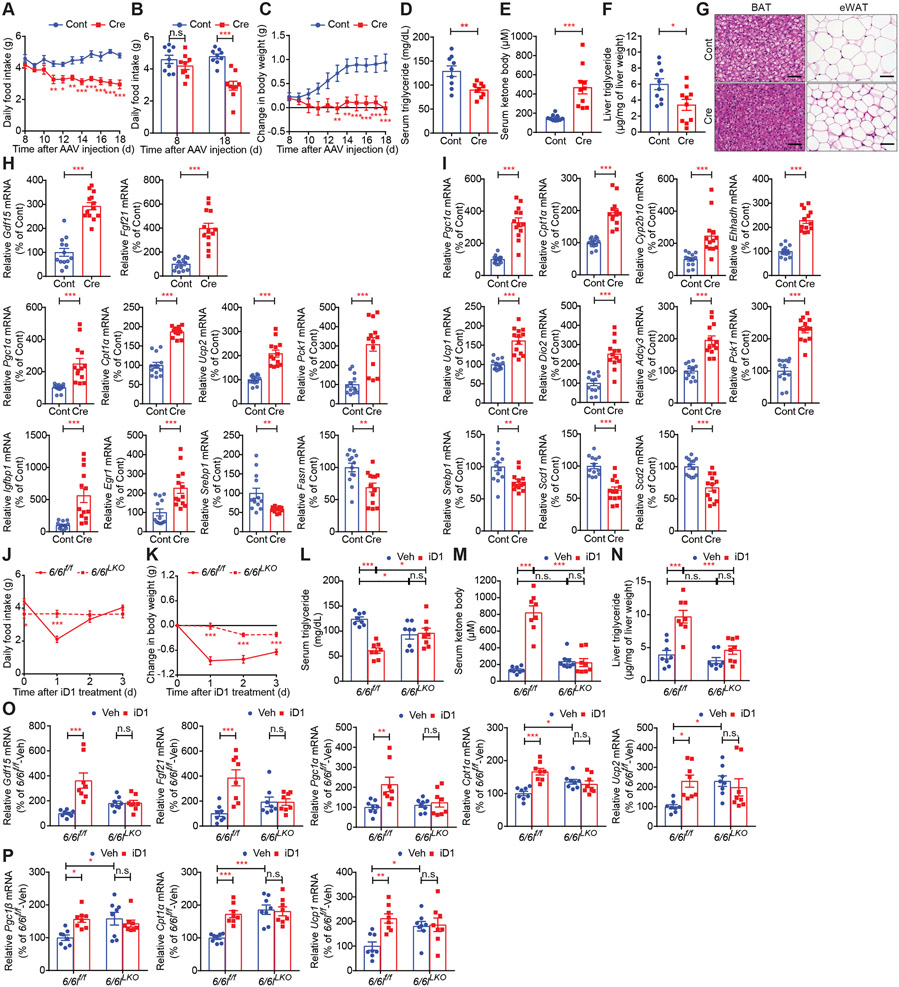
Figure 4. Hepatic Cnot6 and Cnot6l double knockout induces loss of food intake and body weight and stimulates lipid consumption and ketogenesis through an increase in hepatokines.
(A-I) Daily food intake (A), daily food intake 0 and 18 days after AAV injection (B), change in body weight (C), levels of serum triglycerides (D), serum ketone bodies (E), and liver triglycerides (F), representative H&E staining images of the indicated tissues (G), and levels of the indicated mRNAs in livers (H) and BAT (I) of Cnot6/Cnot6l conditional KO mice injected with AAV8 harboring mock (Cont) or Cre recombinase (Cre) under the liver-specific TBG promoter. mRNA levels were normalized to Hprt mRNA. n = 9-13 per group.
(J-P) Daily food intake (J), change in body weight (K), and levels of serum triglycerides (L), serum ketone bodies (M), liver triglycerides (N), and the indicated mRNAs in livers (O) and BAT (P) of control (6/6lf/f) and Cnot6/Cnot6l liver-specific double KO (6/6lLKO) mice after a single administration of Veh or iD1. mRNA levels were normalized to Hprt mRNA. n = 8 per group
Data represent mean ± SEM. *p < 0.05, **p < 0.01, ***p < 0.001; p value by two-way ANOVA with Bonferroni's multiple comparison test for (A-C and J-P) or Student’s t-tests for (D-F, H, and I).
See also Figures S4 and S5.

