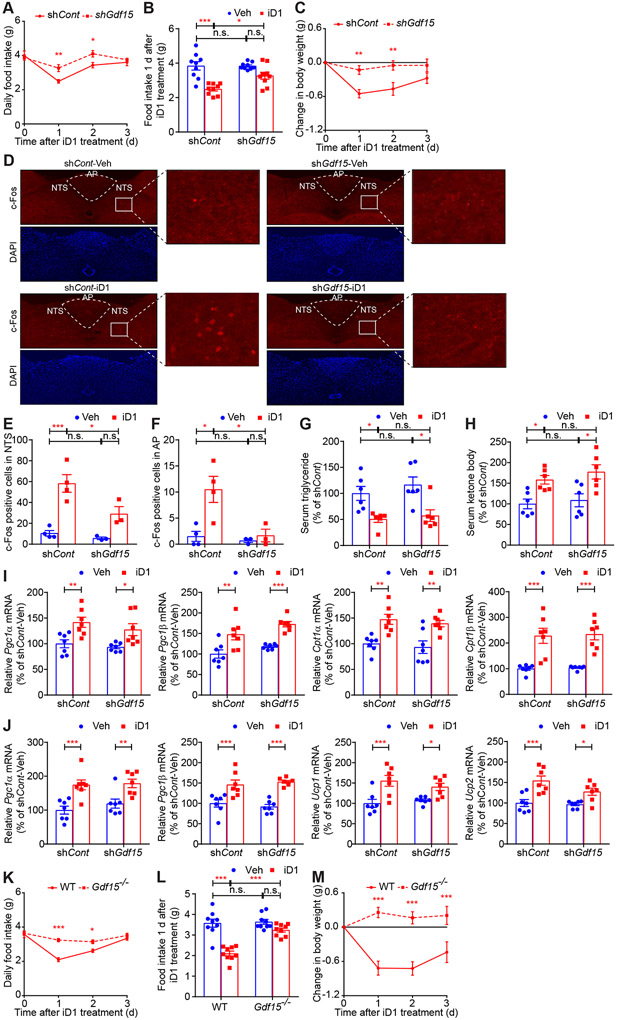
Figure 5. GDF15 mediates the effect of CNOT6L inhibition on loss of food intake and body weight.
(A-J) Daily food intake (A), food intake 1 day after the treatment (B), change in body weight (C), IF staining of c-Fos in NTS and AP of the hindbrain (D), quantification of c-Fos positive cells in NTS (E) and AP (F), and levels of serum triglycerides (G), serum ketone bodies (H), and the indicated mRNAs in livers (I) and BAT (J) of WT mice injected with adenovirus expressing shRNA against Gfp (shCont) or Gdf15 mRNA (shGdf15) after a single administration of Veh or iD1. mRNA levels were normalized to Hprt mRNA. n = 3-9 per group.
(K-M) Daily food intake (K), food intake 1 d after the treatment (L), and change in body weight (M) of WT and Gdf15 KO (Gdf15−/−) mice after a single administration of Veh or iD1. n = 9 per group.
Data represent mean ± SEM. *p < 0.05, **p < 0.01, ***p < 0.001; p values by two-way ANOVA with Bonferroni's multiple comparison test.
See also Figure S6.

