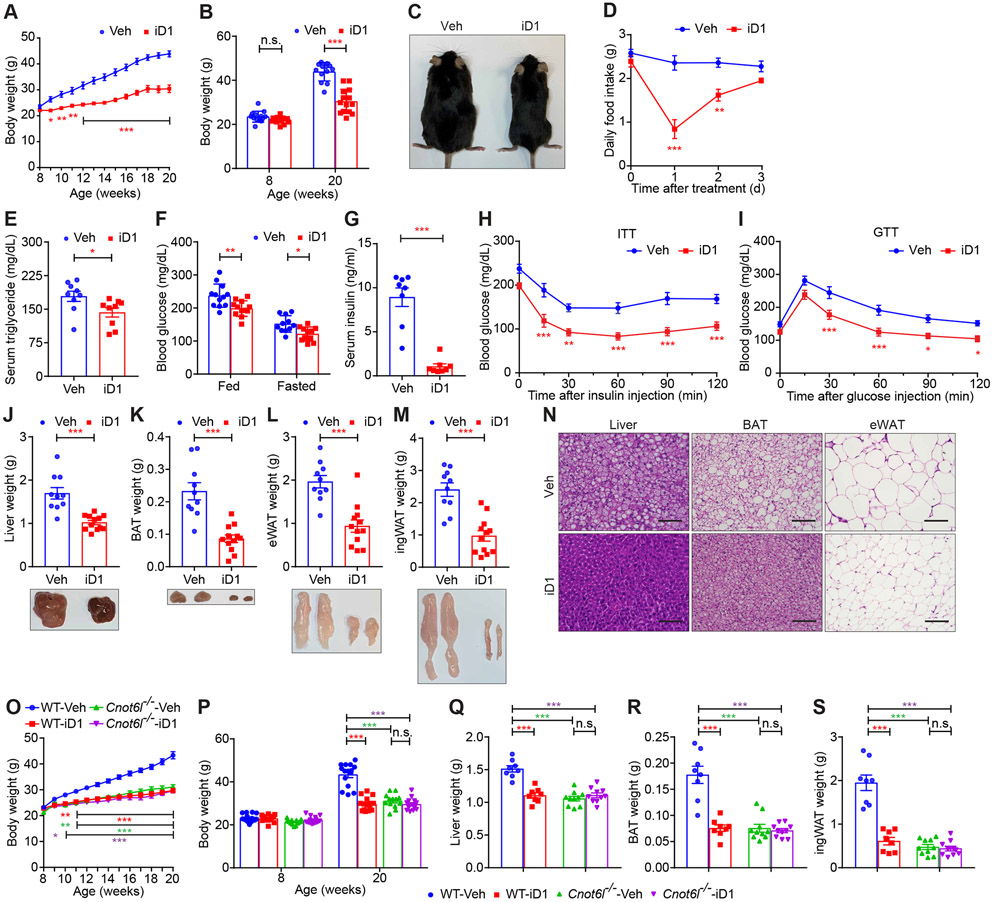
Figure 7. CNOT6L inhibition has a therapeutic potential to ameliorate diet-induced metabolic disorders.
(A-I) Body weight curves for 12 weeks (A), starting (8-week-old) and ending (20-week-old) body weight (B), a representative 20-week-old mouse image (C), daily food intake (D), levels of serum triglycerides (E), fed/fasted blood glucose (F), and serum insulin (G), insulin tolerance tests (ITTs) (H), glucose tolerance tests (GTTs) (I), tissue weights and representative images of livers (J), BAT (K), eWAT (L), and ingWAT (M), and representative H&E staining image of the indicated tissues (N) of WT male mice fed with HFD and treated with Veh or iD1 for 12 weeks. HFD feeding and iD1 treatment started at 8 weeks of age. n = 4-14 per group. Scale bars represent 50 μm.
(O-S) Body weight curve (O), starting and ending body weight (P), and weights of livers (Q), BAT (R), and ingWAT (S) of WT and Cnot6l−/− male mice fed with HFD and treated with Veh or iD1 for 12 weeks. HFD feeding started at 8-week-old. n = 8-15 per group.
Data represent mean ± SEM. *p < 0.05, **p < 0.01, ***p < 0.001; p value by Student’s t-tests for (E, G, and J-M) or two-way ANOVA with Bonferroni's multiple comparison test for (A, B, D, F, H, I, and O-S).
See also Figure S7.

