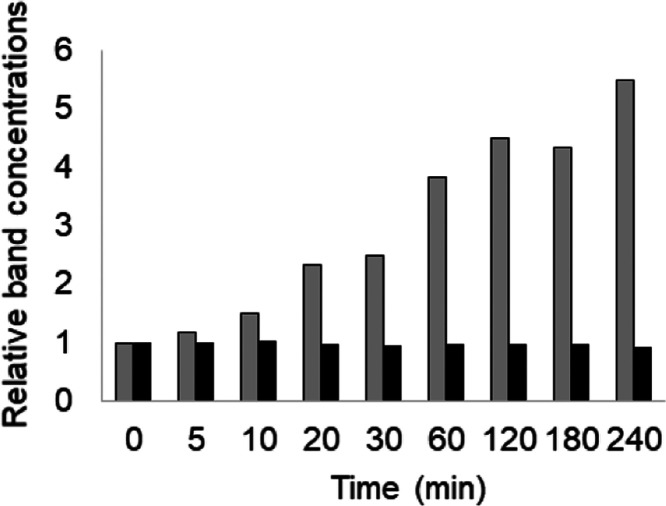
Figure 5.
Quantification of the citrulline concentration based on western blotting quantification (Figure 4). The horizontal axis represents time in minutes. The vertical axis represents the relative value of the band intensity of 0 min as 1. Gray bars and black bars represent the relative band concentrations for AMC and anti-PAD3, respectively. Anti-modified citrulline (AMC); peptidylarginine deiminase 3 (PAD3).

