

Abstract

In this work, a structural analysis of the polyphenol complexes with iron and copper at several conditions is reported. The investigated polyphenols were tannic acid, gallic acid, pyrogallol, and syringic acid, being components and molecular models of the gallnuts usually employed in the past in fabrication of iron gall inks (IGIs). Commercial tannic acid extracted from gallnuts, which is a complex mixture of different gallotannins and simpler galloylglucoses, was also employed in this analysis. This analysis comprised the use of Raman, Fourier-transform infrared (FTIR), UV–vis absorption, and fluorescence spectroscopy. The complexation of iron with these molecules leads to a strong change in color due to the deep restructuring of the polyphenol that can be clearly seen by Raman and FTIR spectra. Three main Raman bands appeared at 1450–1490 cm–1 (ν1), 1320–1345 cm–1 (ν2), and 400–650 cm–1 (ν3), which are characteristic of the metal complexes. The structural changes of the polyphenol complexes with iron were also investigated at different pHs and different polyphenol/iron stoichiometries. Other effects of the interaction of polyphenols with iron are the pH decrease of the mixture upon metal complexation and fluorescence quenching induced by the interaction of iron. This quenching is important since it facilitates the Raman inspection of manuscripts since polyphenols show a strong fluorescence emission that overlaps the Raman spectrum. Furthermore, DFT calculations were performed for the first time on the gallic acid complex with iron in order to elaborate a detailed assignment of the vibrational modes of polyphenols and their metal complexes, something that was missed in previous applications of Raman to IGIs.
Introduction
The investigation of inks is crucial in many aspects. In forensic science, the analysis of inks can reveal information about the origin and nature of the ink, which is transcendental in authenticity determination and forgery discovery when dealing with documents. Raman spectroscopy has been demonstrated to be very useful in the identification of the colorants employed in the fabrication of inks. In fact, a great deal of information coming from the Raman analysis of inks regarding forensics has been published.1,2
Before the appearance of synthetic colorants in the second half of the 19th century in Western countries, the most frequently used were iron gall inks (IGIs). This kind of ink was employed from the 3rd century, although its use was generalized after the 13th century until the 19th century.3 Thus, the investigation of IGIs is of a great importance in the study of historical manuscripts with many implications in cultural heritage. However, the structure of the actual colorant in IGIs is still a matter of controversy. In fact, the structure of the specific true colorant of IGI has been a subject of a long discussion from the first investigations carried out in this sense by Wunderlich et al.,4,5 who proposed a model based on the interaction of several gallate anions with iron in which both the phenolic −OH groups and the carboxylate interact with the metal, giving rise to a rather amorphous material. This model was confirmed afterward by Ponce et al., who carried out a direct and detailed elucidation of the structure of IGIs by different X-ray techniques.6 The latter authors also reported the coexistence of amorphous and crystalline structures in the gallate/iron complex precipitates. However, they did not use their Raman results to establish a proper correlation between the Raman bands and the structure of the complexes.
Raman spectroscopy has been previously applied in the identification of IGIs in historical manuscripts.7−9 However, in these studies, the high difficulty encountered regarding the correlation of the signals with the structure and the detailed assignment of the Raman bands was stressed, which was what led some authors to ask for further research to extract more complete and consistent information from the iron gallate Raman spectra, especially the use of theoretical methods to elucidate the IGI structure.10 In fact, the assignment of IGI bands have been done up to now by comparison to reference molecules such as gallic acid or similar polyphenols.6 The main reasons for these missed investigations have been the intrinsic complexity of the studied materials (the large amount of tannins and polyphenols in gallnuts) and the lack of appropriate and valid assignments of the vibrational bands. In fact, gall extracts are composed of a large number of different phenol compounds whose composition depends on the original plant.11
The chemical basis of the preparation of IGI inks is the formation of iron complexes with tannins existing in gallnuts, leading to a strong change in color to dark blue-black. The IGI colorant includes a rather heterogeneous group of materials where many experimental variables can change the final composition of the ink. However, the common fact of all of the IGI is the combination of at least three ingredients:12,13 (a) the organic material extracted from plant galls; (b) vitriol, i.e., sulfates of different metals, mainly iron, copper, or zinc; and (c) gum arabic. This complex mixture is difficult to analyze. However, it represents a good opportunity to find hints that could provide useful information about many parameters of interest for the historical analysis: the origin of the materials, the recipe employed in its manufacture, the approximate time of the ink fabrication, etc.
The analysis of manuscripts requires non-invasive and portable instruments and methodologies that can be transported to the libraries where the important documents are preserved. Spectroscopy techniques fulfill these requirements. In particular, X-ray fluorescence (XRF) spectroscopy, infrared (IR) absorption, or Raman scattering have been largely employed in the study of the different components of IGIs.14,15 This is due to their non-destructive and portable characteristics. In addition, they can provide complete information about the chemical composition and elemental atomic analysis of the samples (inks and substrate). All these techniques are highly specific as they are based on the identification of the molecular fingerprints provided by each molecular or ionic component.2,16
Raman spectroscopy was employed in the analysis of the chemical structure of many phenols.17,18 Therefore, this technique can afford crucial information regarding the analysis of iron interactions with phenolic compounds, which is the chemical basis of the metal gall inks.19 Raman provides specific and characteristic vibrational signals of organic materials, and thus, it is very suitable in the differential analysis of organic molecular mixtures such as IGIs.20,21 Furthermore, vibrational signatures are very sensitive to possible chemical modifications occurring as a consequence of aging or different environmental changes during the ink preparation (temperature, pH, and radiation). A major concern in the analysis of IGIs is the study of the chemical processes taking place in the formation of complexes between metals, mainly iron, and polyphenols, in particular, gallic acid or tannins. In this sense, Raman spectroscopy can provide highly valuable information about the interaction mechanism and the structure of the resulting complexes.22−27
In the present study, Raman spectroscopy was mainly used to carry out the analysis of different iron and copper complexes of the commercial tannic acid (TA), gallic acid (GA), pyrogallol (PY), and syringic acid (SA) (Figure 1). Commercial tannic acid was previously reported to be a complex and varying mixture of different gallotannins and simpler galloylglucoses.10,29 Since the natural samples extracted from plant gallnuts are actually a mixture of different polyphenolic compounds where different tannins are present, including galloylglucoses and other simpler polyphenols like gallic acid,28 we can consider the commercial TA sample a possible approach to the natural compounds employed in the historic fabrication of IGI inks. This analysis was conducted to find a correlation between Raman spectra and the IGI colorant structure, evaluating the importance of the different functional groups existing in the natural polyphenols (hydroxyl and carboxylate groups). The above molecular models were chosen in order to study the interaction of iron with chemical structures that are actually present in oak gallnuts, the most employed material to fabricate IGIs.11,28 PY and SA were employed as models to study the interaction of iron with similar structures to the GA one, and, more precisely, to evaluate the importance of the presence of both the carboxylic and–OH groups in the benzene ring.
Figure 1.
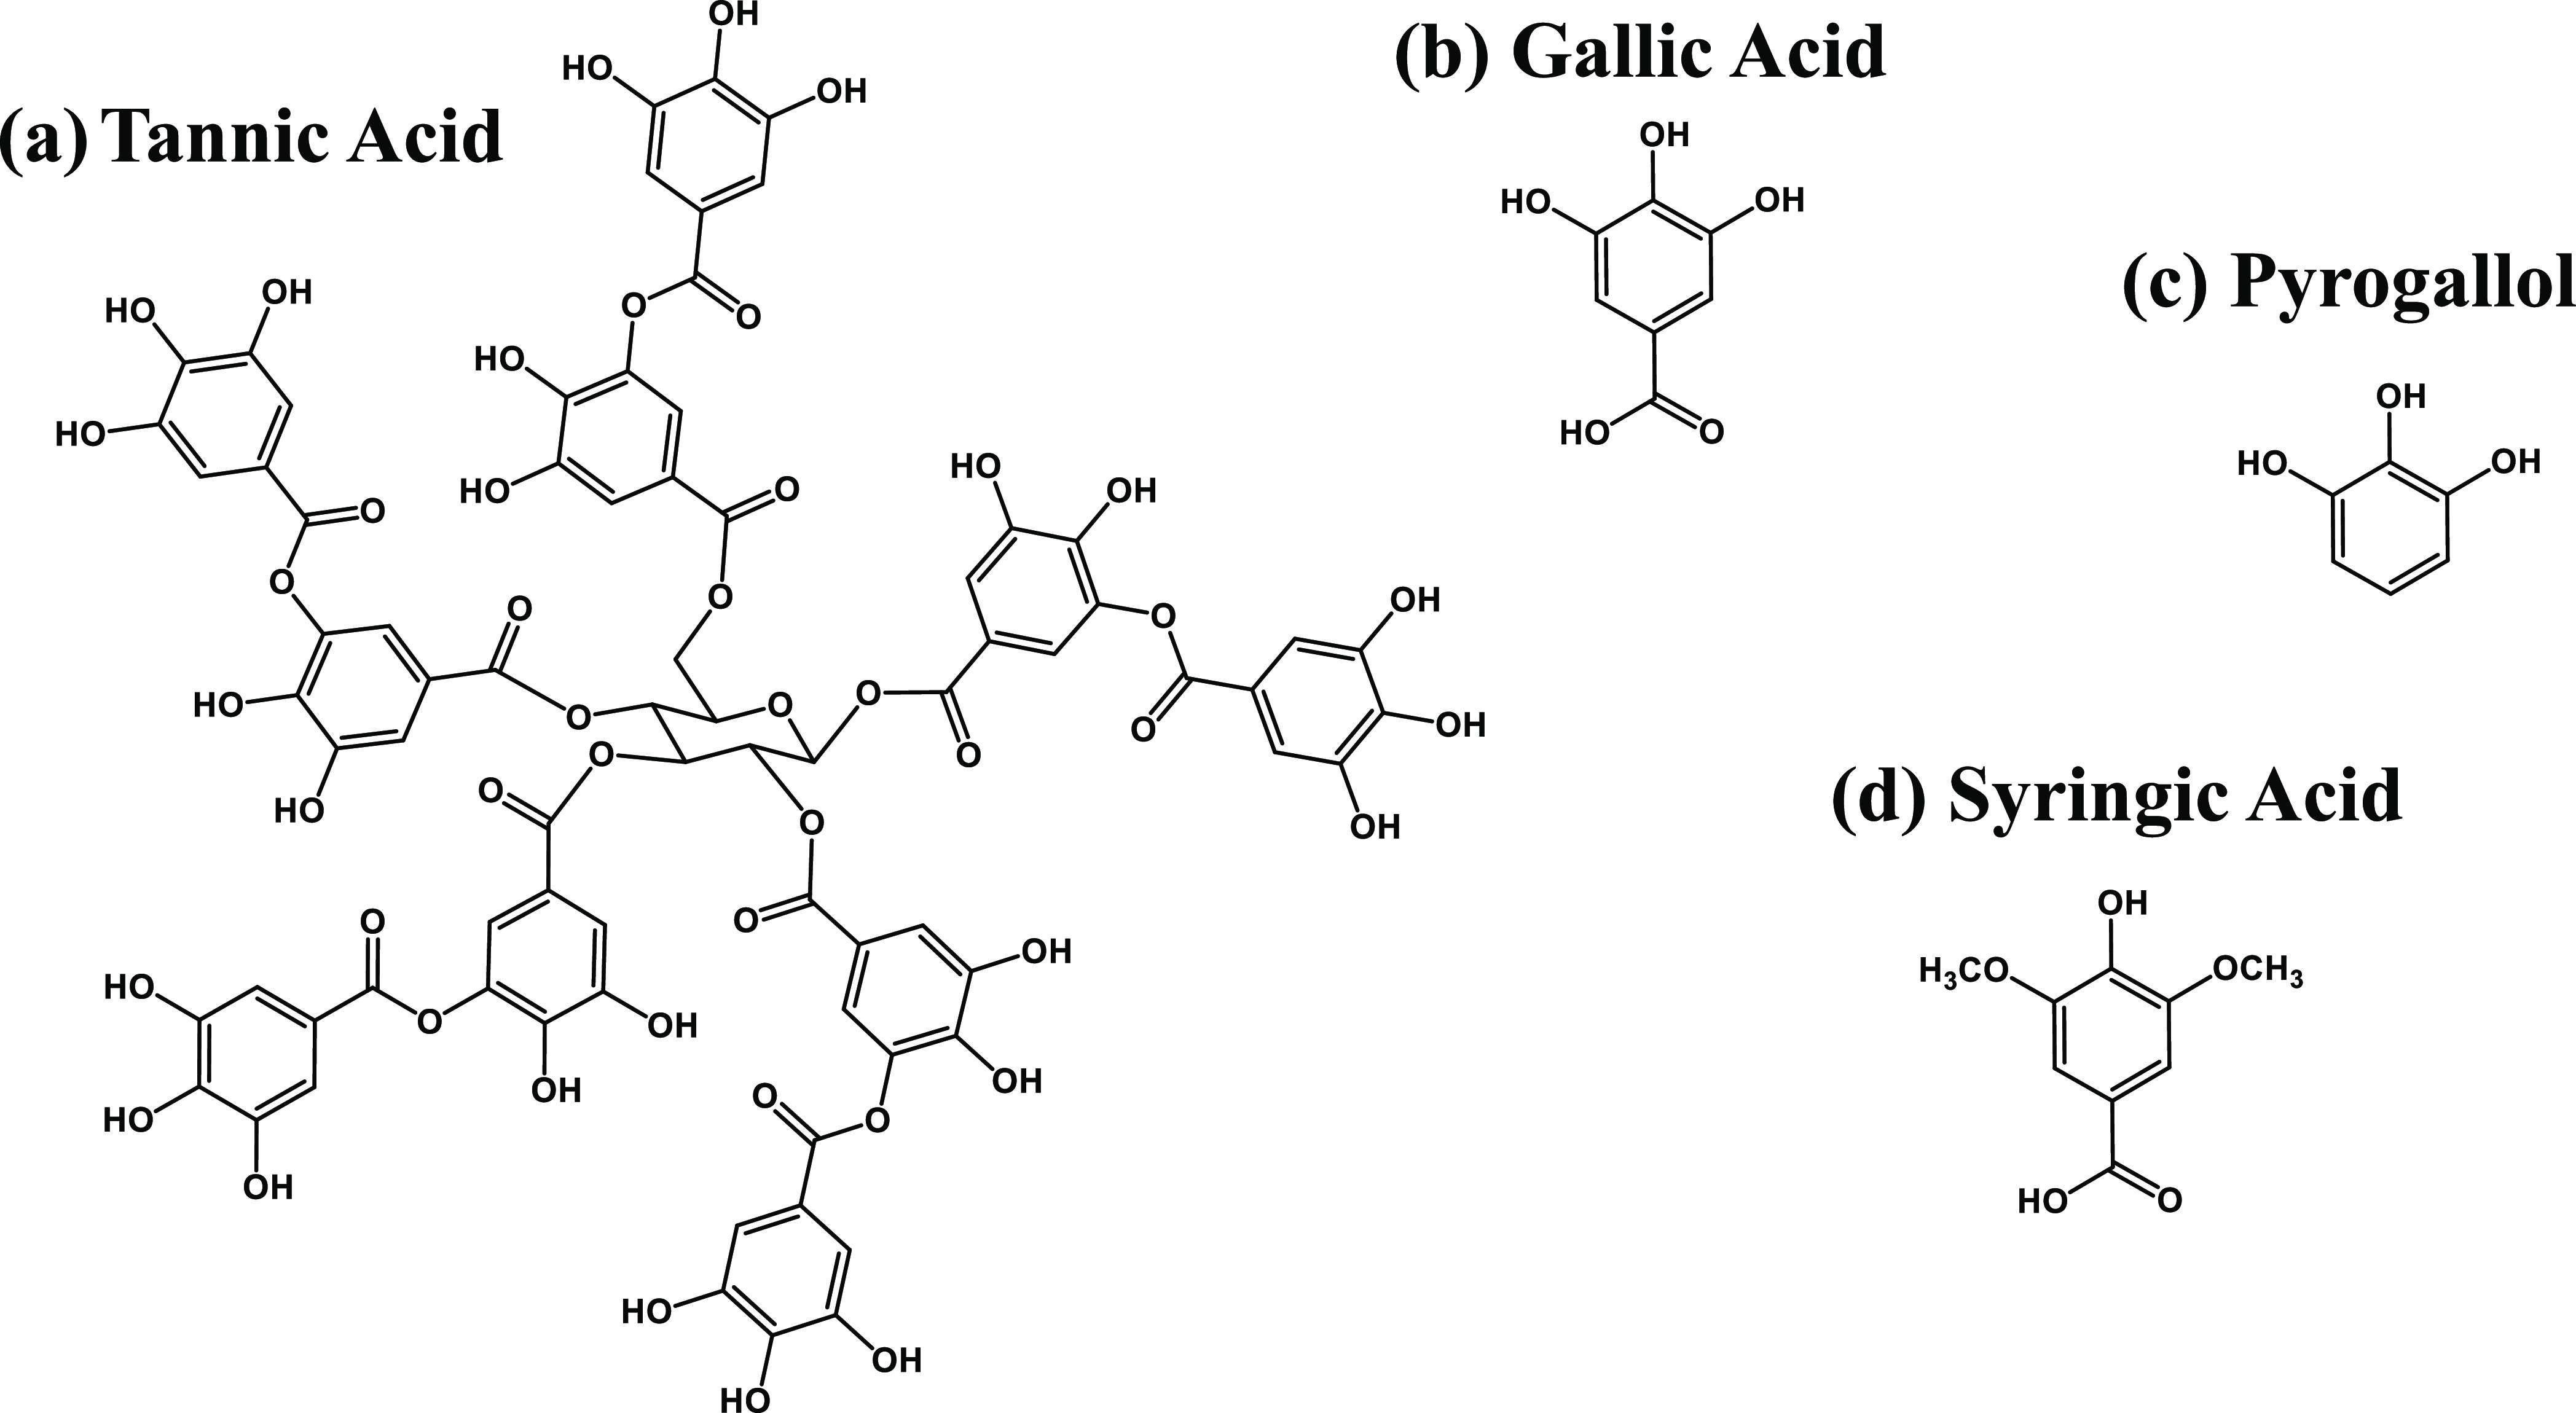
Chemical structure of tannic acid (a), gallic acid (b), pyrogallol (c), and syringic acid (d).
In a previous work, the vibrational characterization of these four molecules was performed.30 UV–vis absorption spectroscopy was also employed to follow the changes in color and perform an analysis of the metal–ligand interaction. This investigation was conducted by measuring the Raman and UV–vis absorption spectra of these polyphenols at different conditions: in solution and deposited on paper, at different pH, and evaluating the effect of the pH, aging, and stoichiometric proportions between iron and polyphenols. In order to elucidate the structure of the IGIs, an optimization of the geometry of GA and two different iron complexes, GACOO–1Fe and GAOH–2Fe, was performed. In the first case, the metal interacts with the carboxylate group of GA, and in the second one, two Fe ions interact with the OH groups of GA molecules. This type of calculations was carried out by density functional theory (DFT) methods. The Raman spectra of the optimized structures were also calculated, in order to aid in the normal mode assignment of the GA, GA–Fe, and GA–Fe2 vibrations.
Experimental Section
Materials
Pyrogallol (1,2,3-trihydroxybenzene; CAS number: 87-66-1; PY), gallic acid (3,4,5-trihydroxybenzoic acid; CAS number: 149-91-7; GA), tannic acid (CAS number: 1401-55-4; TA), syringic acid (3,5-dimethoxy-4-hydroxybenzoic acid; CAS number: 530-57-4; SA), iron(II) sulfate heptahydrate (FeSO4.7H2O; CAS number: 7782-63-0), and copper(II) sulfate pentahydrate (CuSO4.5H2O; CAS number: 7758-99-8) were purchased from Sigma-Aldrich and used as such for the spectral measurements. For the most part, stock solutions of polyphenols in water were prepared at a concentration of 10–2 M and stored in the dark to protect them from light. For the same reason, to minimize the possible photodegradation of the phenol molecules, the examined solutions were protected from light during out-of-measurement times. The stock solutions were further adequately diluted for the required final concentration.
Silver nitrate, trisodium citrate dihydrate, hydroxylamine hydrochloride, and other reagents were of analytical grade and purchased from Sigma-Aldrich and Fluka. Nitric acid and sodium hydroxide aqueous solutions were used to adjust the pH. All solutions were freshly prepared with Milli-Q water before experiments and used immediately.
Preparation of Metal Complexes
Liquid Samples
The stock solutions of molecules were prepared at 2 × 10⁻² M, except for TA where the 2 × 10⁻³ M stock solution was used. Thus, 2 × 10⁻² M PY and 4 × 10⁻² M iron sulfate water solution were used to prepare the corresponding complex at the molar ratio 1:2 (PY–Fe). In the case of SA and GA, we have prepared complexes with the molar ratio 1:3 (SA–Fe or GA–Fe). Finally, the molar ratio of the TA–Fe was 1:30 resulting from mixing TA aqueous solution at 2 × 10⁻³ M concentration with the aliquot of the 6 × 10⁻² M iron(II) sulfate water solution. The same protocol was applied for the preparation of polyphenols-copper complexes. The experiment at different TA–Fe concentration ratios was carried out by preparing solutions of TA and FeSO4 at the concentration 10–2 M in water, and mixing different volumes of these solutions to reach the following TA-Fe ratios (v/v): 10:1, 3:1, 1:1, 1:3, and 1:10. Although Fe2+ was employed in the preparation of the complex, it should be indicated that this ion is oxidized to Fe3+ after the complexation. Therefore, the Fe term refers to the sum of these two cations (Fe2+ + Fe3+).
The pH of the complexes applied on paper was measured by dropping 500 μL of the complex solution on the paper surface. This drop was maintained during 90 s on the paper. Then, the drop was removed from the paper and its pH was measured.
Solid Samples
A drop (∼30 μL) of the previously prepared ink solutions was deposited on filter paper or a glass microscopy slide and left to dry at room temperature until total water evaporation, at least for 24 h. Afterward, the resulted ink layers were scratched and the corresponding ink flakes were analyzed without any other treatment.
IR Pellets
IR spectra were measured on the KBr pellets of the IGIs prepared by mixing the corresponding solid sample and KBr at 1:30 ratio in weight. The resulting samples were dried at room temperature.
Instrumentation
UV–vis absorption spectra were obtained by using a Shimadzu 3600 (Shimadzu Corp., Kyoto, Japan) equipped with a PMT for light detection in the UV–visible range and an InGaAs detector for the near infrared (NIR). Samples were placed in quartz cells of 1 cm optical path after dilution to 30% in Milli-Q water (v/v).
FTIR spectra of pure polyphenols in powder were registered directly by the ATR method at room temperature in the region of 2000–520 cm–1, on the FTIR spectrometer (ABB, model FTLA2000–100) using a Nicolet 8700 IR microscope. The spectra resolution was set to 4 cm–1, and the final spectra are the results of 128 scans. Further, FTIR spectra of iron complexes in KBr pellet were registered by absorption/transmission measurements in a FT-IR Bruker IFS66 spectrometer, performing 1000 scans and using the Globar source and the DTGS detector.
FT-Raman spectra were obtained by using a Bruker MultiRAM spectrometer (model RFS 100/S) equipped with an Nd-YAG excitation source at 1064 nm and a high-purity Ge detector cooled by liquid nitrogen. Spectra were acquired with the 4 cm–1resolution in the spectral range of 4000–100 cm–1, and a 180° geometry was employed. The output laser power was set to 200 mW, and the laser power at the sample was 20 mW. The Raman spectra displayed in this work were the results of averaging 500–1000 accumulations.
Raman spectra were recorded by using a micro-Raman inVia Renishaw spectrometer (Wotton-Under-Edge, Gloucestershire, UK), equipped with an electrically cooled CCD camera, and a Leica DM 2500 microscope. The laser excitations at 785 nm (diode laser) and 633 nm (He–Ne) were employed as excitation sources. The Raman signal was collected over the range of 100–2000 cm–1 (or 4000 cm–1), under macro conditions using glass vials and working with a spectral resolution of 1 cm–1. The laser power at the sample was up to 2 mW. The signal was firstly calibrated by using the 520 cm–1 line of a Si wafer and a 20× objective.
DFT Calculations
For the GA molecule and the GA–Fe and GA–Fe2 complexes, the optimization of the ground state of the structures and the calculation of the theoretical Raman spectra were performed in vacuum conditions with DFT using the Gaussian 09 package.31 Calculations for GA were carried out considering the neutral and deionized (GA–) singlet molecule using a B3LYP hybrid exchange correlation functional in combination with 6-311+G* as a basis set. The calculations of the Fe complexes were performed considering the Fe3+ ion. Two different complexes were calculated considering the interaction of two Fe3+ ions with the ionized −OH groups (complex GAOH-2Fe) and the complexation of one Fe3+ ion with the carboxylate anion (GACOO-1Fe) following the models reported by Ponce et al.6 In addition, the state multiplicities were considered to be quintet and sextet for the complexes with two and one Fe ion, respectively. For simplicity, the coordination water molecules, necessary to complete the octahedral geometry of the Fe3+ complexes, were not included in the analyzed structures. This approximation was previously used in the study of the Fe–catecholate complexes.32 However, other authors included the water molecules in their DFT calculations.33
The mixed basis sets 6-311+G* + LANL2DZ (Los Alamos National Laboratory 2 double ζ) were used for the calculations of the Fe complexes. LANL2DZ is a widely used effective core potential (ECP)-type basis set, and it was used to model the metal atoms.34 Both basis sets have been widely used along with DFT methods for studies of transition metal-containing systems. Thus, the Los Alamos effective core potential was employed on the transition metal, and the Pople-type basis set was used on all other atoms (C, H, and O).
Upon optimization of the molecular geometry, Raman spectra were obtained. No imaginary wavenumbers were observed in the calculated spectra. GaussView 5.09 was employed to view data and output images. Detailed assignments of the vibrational normal modes were based on the best fit comparison of the wavenumbers of calculated and experimental Raman bands. A scaling factor of 1.05 was applied in all cases.
Results and Discussion
UV–visible Absorption Spectroscopy
A study of the UV–vis absorption of GA and TA and their iron and copper complexes was carried out at different pHs ranging from 3 to 12 (Figure S1, Supplementary Material). Figure 2 shows the UV–vis absorption spectra of GA (Figure 2a) and TA (Figure 2b) at selected pHs in order to observe more easily the effect of the different metals. The interaction of iron with all polyphenols studied in this work induced a strong change in color that can be characterized by UV–vis absorption. However, this also can be observed to the naked eye (see inset pictures in Figure 2 for both GA and TA at different pHs ranging from 3 to 12). In addition, the increase of pH in non-complexed polyphenols also led to a darkening that is weaker than that produced by the iron complexation. This fact can be attributed to the ionization of OH groups and a possible oxidation and polymerization of the smaller units, leading to more complex structures.17,35 The UV–vis absorption spectrum of GA (Figure 2a) shows two characteristic phenol bands appearing at 210 and ∼ 260 nm, corresponding to the 1La and 1Lb bands, respectively, originating from π → π* transitions.36,37 These bands are shifted to 213 and 275 nm in the case of the TA sample due to the polymer structure of all the gallotannins and simpler galloylglucoses included in this commercial sample (Figure 2b).
Figure 2.
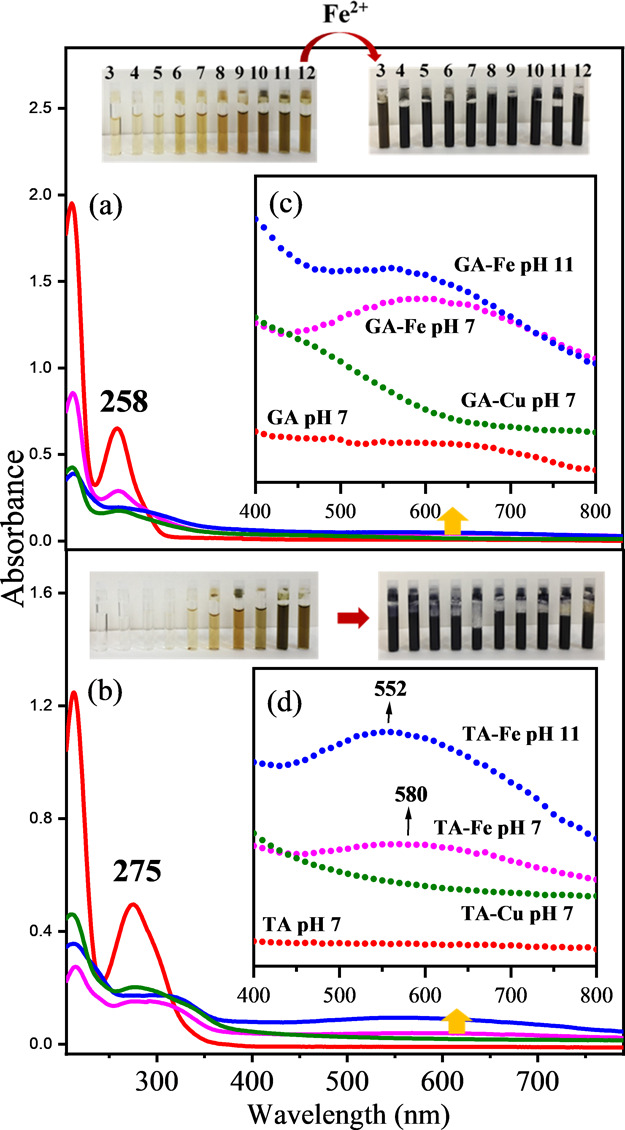
UV–vis spectra of GA (a) and TA (b) without metal (red), with iron at pH 7 (purple) and pH 11 (blue), and with copper at pH 7 (green). Polyphenols were at a concentration of 6.6 × 10⁻⁵ M without metal and at a 1/3 (gallic acid/metal) molar ratio (6 × 10⁻⁵ M/19.5 × 10–5 M) for the GA–metal complex and 1/30 (tannic acid/metal) molar ratio (6 × 10⁻⁵ M/19.5 × 10–4 M) for the TA–metal complex. The region corresponding to the new broad band appearing at longer wavelength due to the ligand-to-metal charge transfer (LMCT) is amplified for tannic acid (c) and gallic acid (d). The inset shows the colors of the polyphenol solutions and their corresponding metal complexes obtained at pH ranging from 3 (left) to 12 (right).
In the case of TA, the band at 275 nm is very broad and also displays a shoulder at ca. 300 nm due to the all possible configurations that are possible in its intrinsic molecular complexity. In the case of PY and SA (Figure S2a,d, respectively), the two absorption bands moves to the red exhibiting different intensities provided by the specific molecular geometry of the corresponding molecular orbitals.
The interaction with metal cations, Fe3+ and Cu2+, induces a weakening of both 1La and 1Lb band intensities together with a redshift. This is more evident for the 1Lb band, which is shifted to 310 nm in the case of TA. In addition, a new broad absorption band appears at longer wavelengths, which in the case of Fe3+ leads to a maximum at 550–580 nm. This new feature is the responsible for the strong color change observed in the interaction of Fe3+ with phenolic compounds. The new broad band appearing at longer wavelength is attributed to the ligand-to-metal charge transfer (LMCT) from the polyphenol to the Fe3+ center of the complex.38,39 It is interesting to note that the maximum of this new band undergoes a blueshift from 580 to 552 nm upon increasing the pH to 11 in both GA and TA. This shift is likely due to the polyphenol autoxidation at alkaline pH, giving rise to quinone structures40 as well as oligomerization of polyphenols promoted at alkaline pH.41,42 However, a change in the interaction stoichiometry of the ligand with the Fe3+ after OH group ionization can also account for this shift.43 The absorbance increase of this band as the pH rises (Figures S1 and S2) is likely connected to structural changes occurring in polyphenols (ionization, oxidation, and polymerization). These changes modify the complexing pattern of these molecules with metal ions.
Usually, the LMCT band in the different iron–phenolic acid complexes are similar but quite different from the value calculated for Fe(OH)63– (ca. 770 nm). This difference can be explained by partly oxidized character for the ligand (semiquinone) and the partly reduced character of iron in the excited state during the charge transfer.44 For this reason, the ultraviolet absorption of iron–phenolic acid complexes is quite different from Fe(OH)6. This is an important fact that is related to the specific structure of polyphenols when complexed by metals, which in turn also depends on the number of ligands surrounding the metal sphere of coordination.38 Also, this effect can serve to establish a correlation between the UV–vis absorption spectrum and the structure.
In the specific case of Cu2+, the LMTC band is rather observed as a shoulder in the 400–500 nm region. This leads to a noticeable increase of the absorbance at 400–600 nm that can be seen in all polyphenols in the presence of the metal, which is summed to the autoxidation and polymerization of the polyphenols and is more evident at high pH (Figure 2c,d and Figures S1 and S2b,e).
Raman Spectroscopy
The Raman spectra of TA displays strong bands at 1711 and 1613 cm–1 (Figure 3a) attributed to the C=O stretching of the carboxylate and the 8a stretching vibrational mode of the benzene ring.45 The assignments of the main vibrational bands are shown in Table S1. These two bands undergo a strong decrease upon the interaction with iron. The band at 1711 cm–1 almost disappears as a consequence of the metal complexation, while the 8a vibration of the benzene ring undergoes a strong decrease and a shift to 1580 cm–1 (Figure 3b,c). This spectrum is dominated by three main bands appearing at 1477 (ν1), 1344 (ν2), and 603 (ν3) cm–1. In fact, these bands are the classic ones employed for a positive identification of iron gall inks in historic documents as described by Lee et al.46Table 1 summarizes the position of these marker bands in the cases of TA, GA, PY, and SA. A similar metal effect was also observed in the case of the GA–Fe complex (Figure 3f,g) and for PY and SA (Figure 4). The big difference between free and the metal-complexed polyphenols suggest a deep restructuration of the polyphenol, which is also translated to their vibrational spectra.
Figure 3.

Raman spectra of TA in the solid state (a), TA–Fe complex on paper (b) and in aqueous solution (2 × 10⁻³ /6 × 10–2 M/M) at pH 7 (c), GA in the solid state (d) and in aqueous solution (2 × 10⁻² M) (e), and GA–Fe complex on paper (f) and in solution (2 × 10⁻²/6 × 10–2 M/M) at pH 7 (g). The excitation line was at 1064 nm for the samples in the solid state (FT-Raman) and 785 nm for the solutions and complexes deposited on the paper.
Table 1. Positions of the Marker Polyphenol–Iron Complex Bands (ν1, ν2 and ν3) and Differences between the Position of the ν1 and ν2 Bands Deduced from the Corresponding Raman Spectra of the Polyphenol–Iron Complexes Recorded at pH 7a.
| ν1 (cm–1) | ν2 (cm–1) | ν1 – ν2 (cm–1) | ν3 (cm–1) | |
|---|---|---|---|---|
| PY–Fe complex | 1464 | 1299 | 165 | 600 |
| GA–Fe complex | 1470 | 1322 | 148 | 576 |
| TA–Fe complex | 1477 | 1344 | 133 | 603 |
| SA–Fe complex | 1489 | 1314 | 175 | 595/490 |
| TA–Cu complex | 1492 | 1319 | 173 | 270 |
For comparison, the same characteristics are also given for the TA–Cu complex Raman spectra recorded at pH 5.
Figure 4.

Raman spectra of PY in solid state (a) and in aqueous solution (2 × 10⁻² M) at pH 7 (b), and PY–Fe complex on paper (c), SA in solid state (d) and in aqueous solution (2 × 10⁻²/6 × 10–2 M/M) at pH 7 (e), and SA–Fe complex on paper (f) and in solution (2 × 10⁻²/6 × 10–2 M/M) at pH 7 (g). The excitation line was at 1064 nm for the samples in the solid state (FT-Raman) and 785 nm for the solutions and complexes deposited on the paper.
The new vibrational features observed in the Raman spectra correspond to the characteristic bands detected in many IGIs found in manuscripts, which have been traditionally employed to attribute black colors in paintings or inks in manuscripts.23−26,46−50 Even so, the assignment of these bands was not carried out in depth so far. In order to elucidate the assignment, we have measured the Raman spectra of TA–Fe complexes at different conditions: (i) in aqueous solution at different pHs and (ii) in the solid state. This analysis was performed to evaluate the influence of pH on the ink. In order to assist in the assignment of the TA–Fe and GA–Fe complexes’ Raman spectra, DFT calculations of GA and the GA–Fe complex were carried out. The resulting theoretical spectra are compared to the experimental spectrum in Figure 5. As can be seen, similar spectral changes are deduced from the calculations between the GA–Fe complex (Figure 5b) and GA (Figure 5c).
Figure 5.
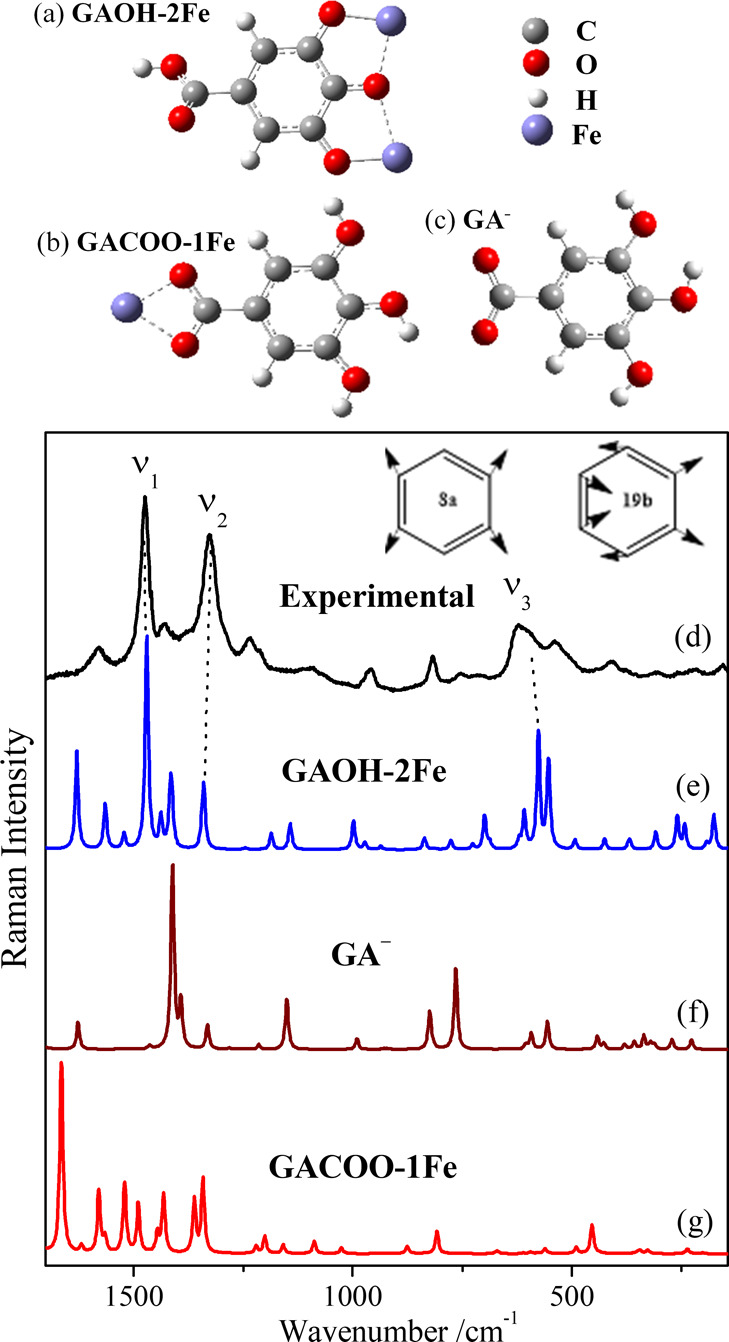
Structure of the GAOH–2Fe complex (a), where two Fe atoms interact with the O atoms placed in positions 3, 4, and 5; GACOO–1Fe (b), where the Fe atom interacts with both O atoms in the carboxylate group and the non-complexed GA– (c) employed for theoretical calculations of spectra. Experimental Raman spectrum of GA–Fe in water (2 × 10⁻² /6 × 10–2 M/M) at pH 7 exciting at 785 nm (d) and calculated Raman spectra of the GAOH–2Fe complex (e), GA– (f) and GACOO–1Fe complex (g). The theoretical spectra were multiplied with a 1.05 correction factor. Schemes of the 8a and 19b benzene ring vibrational modes discussed in the text are included in the figure.
The ν1 band appears in the 1485–1465 cm–1 interval, depending its position on the structure of the phenol (Figures 3 and 4). According to the performed calculations (Figure 5b), this band can be attributed to the benzene 19b vibration coupled to C–O stretching (ν(C–O)) and C–H bending (δ(C–H)). This agrees with the assignment reported by other authors in ortho-disubstituted benzene.45,51,52 Therefore, this vibration has a large contribution from the stretching of carbons attached to the oxygen atoms.51 In general, this band is weak in the non-complexed phenol. However, the complexation gives rise to an intense enhancement because of the strong variation of polarizability that induces the coordination with iron.
In the case of PY, where three OH groups are disposed in an adjacent positions in the benzene structure (Figure 1c), the interaction of oxygen atoms with iron is presumably stronger leading to a ν1 band downshifted to 1464 cm–1 (Figure 4b,c). When the benzene is substituted by more mesomeric (M+) groups, like carboxylic acids or esters, the wavenumber of the ν1 band is shifted to higher values,6 reaching its maximum value at 1489 cm–1 in the specific case of the SA–Fe complex (Figure 4f,g). In this case, the interaction with iron is weaker due to the substitution of the OH by methoxy groups. Therefore, the position of this band is highly connected to the chemical structure of the polyphenol, and it could be used as sensitive marker to classify different inks fabricated from different polyphenolic plant sources.
The ν2 band appears in the 1345–1295 cm–1 region and is attributed to ring stretching bands coupled to ν(C–O) and δ(C–H).53 This mode is also sensitive to the polyphenol structure, and an increase of the wavenumber value is observed in the direction TA > GA > SA > PY (Table 1). This band also exhibits sensitivity to the pH, but this is lower than that of the ν1.
Other less intense bands of the TA–Fe complex appear at 1580, 1430, 1395, 1290, 1217 and 1100 cm–1 (Figure 3c). The relative intensity of these bands is variable among the phenolic compounds and could also help discriminate among the different molecules. Unfortunately, poor attention was devoted to all these bands in previous Raman analysis. The 1580 cm–1 band is attributed to the 8a ring mode, which is strongly weakened upon the interaction with the metal. The 1430 cm–1 band and, presumably, the 1395 cm–1 one are associated to the −COO– symmetric vibrations. These normal modes are present in the TA Raman spectrum due to the existence of an ester and in GA or SA due to the carboxylate −COO–. PY does not show such bands due to the absence of these groups in its structure. The weak doublet at 1299/1217 cm–1 and the broad band at 1100 cm–1 (Figure 3c) can be assigned to ν(C–O) and δ(C–H) vibrations.52 These bands can be very useful in the identification of phenolic compounds in inks due to the fact that they are related to the specific localization and substitution pattern in the ring of polyphenolic compounds.
The ν3 band is attributed to the stretching modes of the new Fe–O bonds (ν(Fe–O)) resulting from the interaction of iron with oxygen in polyphenolic compounds.54,55 This band can appear in a very large range of wavenumbers from 650 to 400 cm–1. In this region, several peaks can be distinguished that are related to the different interactions of the iron cation with the oxygen atoms in polyphenols. In fact, different ν(Fe–O) bands appearing at 650, 600–595, 560–550, and 400 cm–1 can be seen in the Raman spectra of TA and the other polyphenols.
The position of the ν(Fe–O) bands can vary due to the different molecular environment of this bond. In amorphous IGI complexes, as it is the most common case, a non-completely coordinated Fe octahedral coordination sphere is expected, and thus, the octahedron is completed with water molecules in chelate (Figure 6a) and bichelate (Figure 6b) complexes.6,10,56 In this case, there will be a coupling of the Fe–O stretching with the Fe–O–H bending vibrations. Conversely, in crystalline IGI complexes the iron octahedral coordination sphere is supposed to be completely filled with GA molecules (Figure 6c) that can interact with the metal through both the OH and carboxylate groups in a bridging structure. Another element of variability is the fact that iron can be found under two different forms (Fe2+ and Fe3+). This is due to the incomplete oxidation of the ferrous form of vitriol, stopped in part by the reducing character of the paper, since the position of the Fe–O stretching band is predicted to vary depending on the state of oxidation of iron.33 Since ferrogallic ink recipes often imply a large excess of the ferrous sulfate, the reaction products of Fe2+with cellulose may even be a major constituent of the ferric iron in manuscripts.57
Figure 6.

Schemes of the different possibilities in the GA–Fe coordination complex at the level of the iron octahedral coordination sphere: (a) chelate, (b) bichelate, and (c) completely bridged complex.
Because of this high variability, the exact structure of iron complexes in inks is still unknown. Ponce et al. reported a structure where three iron atoms interact with a single molecule of gallate at a 3:1 concentration ratio of Fe and GA.6 According to this, two different types of Fe–O bonds could be associated with the complex: those linked to the −OH groups and those associated to the carboxylate. Figure 5 shows the theoretical Raman spectra resulting from the calculation of two different GA–Fe complexes: one having two Fe3+ ions interacting with the −OH groups (GAOH–2Fe complex; Figure 5a,e) and another where one Fe3+ interacts with both O atoms in the carboxylate group in GA (GACOO-1Fe complex; Figure 5b,g). As can be seen, the first one matches better the experimental GA–Fe spectrum (Figure 5d), and it is also very close to the experimental TA–Fe.
The normal mode calculation also predicts several vibrational modes corresponding to the symmetric and asymmetric Fe–O stretching in the GAOH–2Fe appearing between 550 and 650 cm–1 (Figure 5e). The lower component of the experimental TA–Fe and GA–Fe complexes (at 560 cm–1) can be attributed to bichelate ring vibrational modes as in the case of catecholate–iron complexes (Figure 6b).51,58 Conversely, the higher component (595–600 cm–1) is assigned to Fe–O vibrations associated to chelate interactions where terminal −OH groups interact with the metal and the coordination sphere is completed with water molecules (Figure 6a).59 In the latter complexes, the ν(Fe–O) vibration is coupled to deformations of either Fe–O–H bonds and the benzene deformation rings at these lower wavenumbers.33 Moreover, the 490 cm–1 band observed in the SA–Fe complex can be ascribed to the Fe–COO– symmetric stretching band, which corresponds to the theoretical band at 452 cm–1 in the case of the GACOO–1Fe complex (Figure 5g). The last band is not seen in the GA–Fe complexes, so a preferential interaction of iron with the −OH groups is deduced for the amorphous complexes. Finally, the extreme bands at 650 and 400 cm–1 can be attributed to Fe–O stretching in bridging structures (Figure 6c),60 which are more evident in more crystalline IGIs.
Therefore, the bands related to Fe–O bonds are very sensitive to the ink preparation protocol and, presumably, on the aging process after its fabrication. Thus, they could also serve to discriminate among different types of IGIs.
FTIR Spectroscopy
The FTIR spectra of the GA and TA complexes with iron are shown in Figure 7. The FTIR spectra of non-complexed GA and TA are shown for comparison in Figure S3. The FTIR spectra of these molecules are dominated by strong broad bands at 1200–1000 cm–1 attributed to ν(C–O), ν(C–C), and in-plane δ(C–H) and δ(C–OH) motions.61,62 In addition, intense absorption bands at 1309 and 1308 cm–1, respectively (Figure S3a,b), which are related to the coupled vibrations of the ring ν(C–C) and the carbonyl ν(C=O), are formed together with the contribution from δ(C–H) and δ(C–OH) vibrations.63 The band assigned to ν(C=O) vibrations are observed at 1699 and 1693 cm–1, respectively.
Figure 7.

FTIR spectra of the (a) GA–Fe and (b) TA–Fe complexes. The spectra were collected in KBr.
While in the Raman spectra the ring stretching vibrations in polyphenols are very prominent and highly characteristic of the aromatic rings (these vibrations appear in the range of 1650–1200 cm–1), in FTIR spectra, these vibrations are less intense than those involving oxygen functional groups. The GA spectrum shows the 8a benzene ring band at 1608 cm–1, while that of TA shows that this band downshifted to 1606 cm–1 (Figure S3).
The complexation with iron induces strong changes in the 1300–1000 cm–1 region. In the GA spectrum, the strong bands at 1309 and 1014 cm–1 decrease, and a strong feature at 1083 cm–1 appears instead (Figure 7a). Since these bands have a large contribution from the ν(C–O), δ(C–OH), and ν(C–C) vibrations, an interaction of iron with the −OH groups of the phenolic group is deduced. The strong band appearing at 1382 cm–1 in the GA–Fe complex is attributed to the carboxylate group interacting with the metal in the complex. Additionally, the interaction with OH groups induces intense changes in the out-of-plane bending vibrations of the O–H group (γ(OH)): the band at 870 cm–1 is weakened, and the 731 cm–1 band is shifted to 750 cm–1. The new band observed at 607 cm–1 can be assigned to the ν(Fe–O) band of the GA–Fe complex.
Similar results were observed in the FTIR spectrum of the TA–Fe complex (Figure 7b). The intense bands seen at 1308, 1178, and 1014 cm–1 in TA spectrum (Figure S3b) decrease in the case of the TA–Fe complex (Figure 7b), and a strong band at 1085 cm–1 appears. Furthermore, the ν(Fe–O) band appears at 600 cm–1. The bands at 1710, 1440, 1343, and 1202 cm–1 in the complex are associated with the ester group in TA.61,62 All these bands undergo a large shift upon complexation that suggests the interaction of iron with the ester groups.
pH Effect
The structure of the polyphenol is not a unique factor that can affect the position of bands in the Raman spectrum in IGIs. We have observed that some phenol bands can undergo a shift in these inks due to a possible structural degradation caused by light, pH, humidity, and other unknown effects that evolve with time (results to be published).
In this work, we have focused on the effect of pH on the Raman spectra both in solution and in the solid ink deposited on paper. In the TA–Fe complex, a shift from 1478 to 1472 cm–1 is noted upon increasing the pH of the original TA solution from 3 to 12 (Figure S4). In contrast, this band shifts from 1469 to 1482 cm–1 in the GA–Fe complex on paper. A similar trend is observed in solution (Figure S5). The same can be observed for the PY–Fe complex, where this band shifts from 1452 to 1467 cm–1 in going from acidic to alkaline pH (Figure S6). In contrast, a negligible sensitivity to the pH variation is observed in the case of the SA–Fe complex (Figure S7).
In addition, pH and redox processes are linked in IGIs. The effect of iron on polyphenols cannot be only simplified in a mere change in the color based on a darkening of the solution. The presence of Fe2+ can also induce a series of redox reactions related to the Fenton reaction due to the presence of molecular oxygen in the solution where the pH plays an important role.64,65 The Fe2+ ion undergoes autoxidation by the molecular oxygen, leading to the formation of Fe3+.66 This autoxidation is strongly pH-dependent, and it is almost hampered at pH below 7,67 but the strong interaction of Fe3+ with polyphenols, in particular, gallic acid, accelerates the autoxidation,68 giving rise to the strong darkening of the solution. On the other hand, the complexation with polyphenols induces the release of protons to the medium, thus inducing a pH decrease. Therefore, despite the pKa values being in the range of 7–9 for the most phenolic hydrogen, polyphenols are easily deprotonated at or below neutral pH in the presence of iron and form very stable complexes.60 All these processes are fast and occur immediately after the addition of ferrous sulfate to the polyphenol solution. The oxidation of Fe2+ to Fe3+ upon binding to polyphenol ligands is facilitated by the higher stability of the interaction of Fe3+, which is a harder Lewis acid than the ferrous ion, with the hard Lewis base oxygen ligands existing in polyphenols.60 Afterward, slower redox processes can occur consisting of the oxidation of polyphenols, in particular pyrogallol-like ones,19,69 giving rise to o-quinone structures and Fe2+, and releasing H+ ions with the time. These processes are considered responsible for the subsequent acidification of IGI inks and the degradation of paper in ancient manuscripts.
Because of all the above effects, one of the consequences of the redox processes occurring in IGIs is the pH decrease in the mixture. As can be seen in Figure 8a, the addition of Fe2+ to a TA solution prepared at pHs ranging from 3 to 12 leads to a reduction of pH of the mixture. The value of the pH is maintained at 3 until the pH of the TA solution is increased above 9. This is an effect related to the ionization of OH groups in polyphenols. The pH decrease is moderated when the ink is deposited on paper since it stays constant at 6.5 regardless of the pH of the TA solution. Only when the pH of the solution is above 9 does it increase up to 7 in presence of the TA–Fe complex. This effect can be attributed to the buffering effect of the cellulose of the paper on the pH ink. A similar effect was observed when using other polyphenols and Cu2+ instead of iron. The addition of gum arabic, another important ingredient of IGI inks, to the tannic–iron complex also induced an increased pH.70
Figure 8.

(a) Variation of the pH in the TA–Fe complex at the following situations: in a just prepared aqueous suspension (black circles), the same aqueous suspension after 25 days (open triangles), and after drying on paper (open circles). (b) Variation of the ν1/ν2 ratio with the pH of the original solution for the TA–Fe (shaded squares) and GA–Fe (open circles) complexes. (c) Raman spectra of the TA–Fe complex measured at different pH regulated after the formation of the complex. Samples on the paper. Excitation at 785 nm.
The acidification of TA–Fe complexes seems to occur as well in the case of GA–Fe, PY–Fe, and SA–Fe complexes as deduced from the similar behavior at different pHs. The effect of time with further acidification was also observed for the other polyphenols. This means that this is a general behavior of these compounds.
Since the pH of the polyphenol solution is decreased after the complexation with iron, the a posteriori effect of pH after the formation of the complex was also analyzed. Figure 8c shows the Raman spectra of TA–Fe complexes at pHs ranging from 3 to 12. The resulting spectra show changes in the 1473/1340 cm–1 bands, which slightly shift to higher wavenumbers, while the (ν1–ν2) value decreases as the pH gets more alkaline. These changes can be attributed to the ionization of OH groups since the ν(C–O) and δ(C–OH) vibrations of these groups are involved in the ν1 and ν2 bands. On the other hand, the intensity ratio between the two main bands (ν1/ν2) increases as the pH is raised (Figure 8c), and this variation is higher than that observed when the pH was modified before phenol/iron complexation (Figure 8b). All these changes can be attributed to the higher electron delocalization induced by OH ionization.
In addition, the ionization of OH groups highly affects the complexation pattern of polyphenols with iron. This is evident when analyzing the situation of the Fe–O bands. The main band observed at 608 cm–1 at pH 3 indicates that the interaction at acidic pH is taking place through terminal −OH groups in TA. Moreover, these Fe atoms might be also coordinated to water molecules forming TA–Fe–OH2 adducts. However, the increase of other Fe–O stretching bands at 523 and 400 cm–1 at alkaline pH suggests the existence of other structures where the coordination sphere of iron is completely filled by phenolic groups, leading to the formation of TA–Fe–TA adducts.43,71 The increase of the coordination number at alkaline pH values is attributed to the higher stability of the complexes of completely coordinated Fe atom after the ionization of polyphenols.60 Moreover, a possible degradation of IGIs can be also induced at alkaline pH since similar bands are also observed in historical inks analyzed by Raman.25 The degradation of inks could be related to the increase of redox processes occurring in the polyphenol–iron mixture that can lead to the oxidative browning of the ink with time. This color change is produced by the slow oxidation of polyphenols to o-quinone structures. Moreover, the oligomerization of polyphenol units associated to the OH ionization and quinonization of the ring can also occur.17,41,72
Effect of the Polyphenol Structure on the Raman Marker Bands
The difference between the position of the ν1 and ν2 bands is associated to the structure of polyphenols since these bands are related to the degree of electronic delocalization (ED) inside the aromatic system. In general, the smaller this difference, the higher the ED. At pH 7, this difference is 133, 148, and 165 cm–1 for the TA–Fe, GA–Fe, and PY–Fe complexes, respectively (Table 1). The delocalization is higher in TA due to the polymerization of several GA units. For SA, this difference rises to 175 cm–1, which is also attributed to the lower ED of this molecule due to the presence of methoxy groups. These functional groups exert a positive mesomeric effect on the aromatic ring due to the withdrawal of electrons from the aromatic system.
The ν1 band is also related to the electronic state of phenolic rings as it depends on the bond order inside the benzene ring of the phenol. Moreover, the intensity ratio between the two main bands (ν1/ν2) can be related to the structure of the ligand in the complex as this ratio depends on the ionization state (related to the −OH groups) of the molecule, and thus, it depends on the pH of the medium. In degradation processes resulting from the manuscript aging, this ratio was demonstrated to be very useful to deduce the time effect (result not yet published). Figure 8b shows the variation of the ν1/ν2 ratio with the pH for TA and GA, where a clear increase of the ν1/ν2 ratio when increasing the pH is observed. In fact, at high pH, the ionization of phenol groups to phenolate induces a negative mesomeric effect (M-), which increases the bond order of the ring C=C bonds in the aromatic ring. This leads to an enhancement of the ν1 band intensity.
Fluorescence Quenching
One of the most interesting effects of the complexation of iron with polyphenols is the strong fluorescence quenching induced on the Raman emission spectra of these molecules. Figure 9a shows the Raman + fluorescence spectrum of TA before and after complexation with iron. The spectrum of TA in aqueous solution shows a large fluorescence emission centered at 2000 cm–1 (which corresponds to 724 nm since the excitation line was 633 nm in this case), which increases at alkaline pH (red bars in Figure 9b). This is attributed to the absorbance increase undergone by TA in the red region at alkaline pH due to the formation of phenolate ions (Figure S1) and the possible structural change of polyphenols at high pH. The complexation with iron leads to a significant quenching of the fluorescence emission band. This quenching is attributed to the LMCT from the polyphenol to the Fe3+ center of the complex. In addition, the fluorescence decrease is effective at all the studied pH, being higher as the pH increases (Figure 9b). This effect limits the analysis of IGIs by fluorescence imaging techniques and favors IGI Raman analysis.
Figure 9.
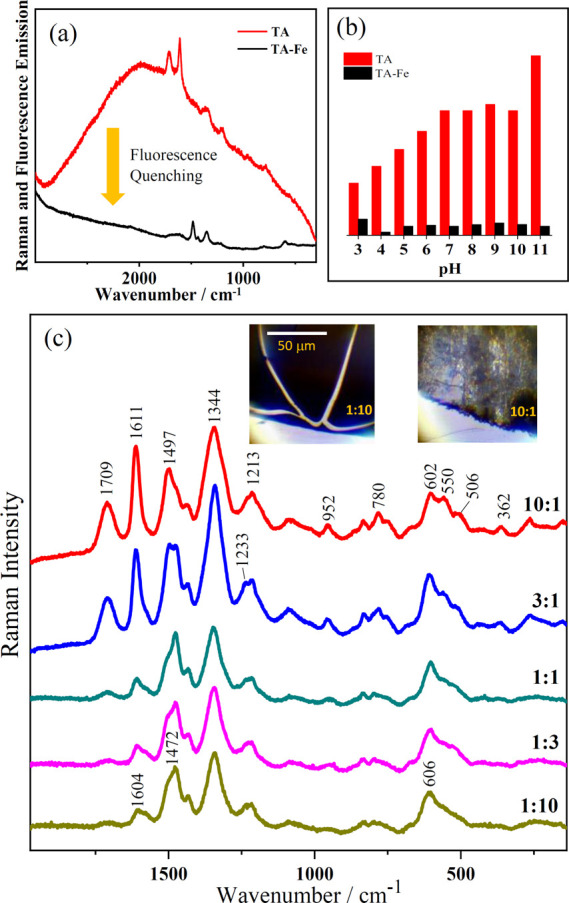
(a) Emission (Raman and fluorescence) spectra of TA and the TA–Fe complex measured at pH 6 (excitation at 633 nm). (b) Variation of the fluorescence emission of the 2000 cm–1 band (724 nm) for TA alone and the TA–Fe complex at different pH (excitation at 633 nm). (c) Raman spectra of the TA–Fe complexes deposited on paper at different TA:Fe relative ratio as indicated on each spectrum, meaning that this ratio was used in the different added volumes of original 10–2 M concentrations of both TA and FeSO4 in aqueous solution. Inset pictures correspond to the TA–Fe complexes prepared by using 10:1 and 1:10 ratios, respectively, and deposited on the paper.
Effect of Iron Concentration
Figure 9c shows the Raman spectra of TA–Fe complexes obtained after varying the relative concentrations of TA and FeSO4 in aqueous solutions. This experiment was carried out in order to test the influence of the relative ligand-to-metal (TA:Fe) stoichiometry in the resulting complex. At relatively high TA concentrations (9 × 10⁻³ M in the 10:1 ratio complex, v/v) a clear effect of iron is already observed with the appearance of the ν1 band at 1497 cm–1, the ν2 band at 1344 cm–1, and the ν3 band at 602 cm–1. At this high concentration, the number of bridged oligomers rises as demonstrated by the presence of Fe–O stretching bands at 550, 506, and 362 cm–1. A progressive downshift of the ν1 band from 1497 to 1472 cm–1 is observed upon increasing the iron concentration. In addition, the band at 606 cm–1 in the Fe–O stretching region dominates the spectrum at high metal concentration. This is observed from 1:1 to 1:10 complexes, 5 × 10⁻³ M:5 × 10⁻³ M and 10–3 M/9 × 10–3 M TA–Fe ratios. These changes are a consequence of the coordination restructuration of the TA–Fe complex at different relative metal concentrations. Thus, a transition from bridged (TA–Fe–TA) to terminal (TA–Fe–water) structures takes place as the concentration of iron is increased. As the relative concentration of iron increases, a weakening of the 8a mode of benzene, which is downshifted, and a strong enhancement of the 19b mode at 1472 cm–1 are also observed. The iron concentration also has an important effect in the texture of the resulting sample. Inset images in Figure 9c show the pictures of two dried complexes obtained at 10:1 and 1:10 ratios. The former shows a rough grainy appearance, and the latter displays a darker and flat look.
Copper Complexes
The interaction of the ion Cu2+ with all the polyphenols was also investigated. Figure 10 shows, as an example, the spectrum of the GA–Cu complex at pH 5 together with the corresponding GA–Fe spectrum. In general, the resulting Raman spectra of the copper complexes are much weaker than the iron ones, as indicated by the stronger sulfate band. This is attributed to a lower Raman resonance effect of these complexes. UV–vis absorption spectra reveal the existence of LMCT band at ca. 500 nm (Figure 2a,c). The general increase of the absorbance in the visible region induces a darkening of the solution. However, the suspension adopted a reddish color due to the blueshift of the absorbance maximum. The interaction with Cu2+ ions induces similar spectral changes on GA as observed for the GA–iron interaction. The most intense bands are observed at 1492 and 1319 cm–1, corresponding to the ν1 and ν2 modes. The difference between these bands is 173 cm–1, which is very similar to the difference observed for iron when interacting with SA (Table 1). This fact indicates that the interaction with copper ions is weaker than that of iron, since the degree of electronic delocalization inside the aromatic system is also low. The ν3 band corresponding to the Cu–O interaction may correspond to the band observed at 270 cm–1 since this is the most intense band also observed in CuO oxide.73
Figure 10.

Raman spectra of the TA–Cu complex (a) as compared to the TA–Fe complex (b) at concentration 2 × 10⁻³/6 × 10–2 M/M. The inset plot displays in more detail the region corresponding to the vibrational modes ν1 and ν2. The upper picture shows the colors of the TA–Cu complexes obtained at pH ranging from 3 (left) to 12 (right).
Conclusions
The interaction of both iron and copper with polyphenol induces a darkening of the solution due to the absorbance of light in the 500–600 nm region. This absorption is very broad and extended over the 400–700 nm spectral region. The copper complex leads to a less defined band at lower wavelengths, ca. 500 nm.
The interaction with these metals leads to a strong change in the structure of polyphenols that can be clearly observed in the Raman spectra. Three main Raman bands or groups of bands appeared at 1450–1490 cm–1 (ν1), 1320–1345 cm–1 (ν2), and 400–650 cm–1 (ν3), which are characteristic of the metal complexes. The main effects of iron on the Raman spectrum are the weakening of the 8a mode of the benzene ring, the large enhancement of the 19b mode (ν1), and the appearance of a new band corresponding to the Fe–O stretching vibration (ν3). In the case of copper, the ν3 band appears at lower wavenumbers (270 cm–1). In FTIR, the effects of the complexation are better observed in the 1300–1000 cm–1 region, where a large contribution from the ν(C–O), δ(C–OH), and ν(C–C) is expected.
The position and intensities of the ν1, ν2, and ν3 bands can be used to characterize the complex in function of the structure of the polyphenol employed in the formation of the complex, pH, and complex stoichiometry. The difference between the position of the ν1 and ν2 bands is connected with the structure of the polyphenols since these bands are related to the degree of electronic delocalization of the aromatic system. However, the intensity ratio ν1/ν2 is related to the structure of the ligand as it depends on the ionization state of the molecule, which increases with the pH, both in solution and on paper. The ν3 bands are directly related to the structure of the Fe3+ coordination sphere and depends on the crystallinity of the resulting complex.
The interaction with iron produces side effects such as pH lowering and fluorescence quenching. The latter effect is a positive effect for the study of these complexes by Raman as polyphenols show a strong fluorescence emission that overlaps the Raman signal. The pH decrease is a negative effect in the case of the use of IGIs as it induces a progressive degradation of the paper. In addition, it was demonstrated that the pH decreases even more with time after the deposition of the complex on the paper.
The DFT calculations performed in this work were useful to carry out an accurate assignment of the vibrational modes of polyphenols and their metal complexes. This research was missing in previous applications of Raman to IGI inks. Indeed, this accurate assignment will also be used for future investigations dealing with the analysis of iron gall inks present in historical manuscripts.
Acknowledgments
This work was supported by the research grant provided by the Grant Agency of the Ministry of the Education, Science, Research, and Sport of the Slovak Republic (VEGA 1/0929/16), by the grant of the Faculty of Science, P. J. Safarik University in Kosice (VVGS-PF-2020-1432) and by the project OPENMED (ITMS2014+: 313011V455) from the EU structural funds. This work has also been financially supported by Ministerio de Ciencia e Innovación/FEDER funds (projects FIS2017-84318-R and PID2020-113900RB-I00/AEI/10.13039/501100011033).
Glossary
Abbreviation
- ED
electronic delocalization
- GA
gallic acid
- IGI(s)
iron gall ink(s)
- LMCT
ligand-to-metal charge transfer
- (Ag) NPs
(silver) nanoparticles
- PY
pyrogallol
- SA
syringic acid
- SERS
surface-enhanced Raman scattering
- TA
tannic acid
- UV–vis
ultraviolet–visible
Supporting Information Available
The Supporting Information is available free of charge at https://pubs.acs.org/doi/10.1021/acsomega.2c01679.
UV–vis absorption spectra of GA, TA, PY, and SA at different pHs; Raman spectra of TA–Fe, GA–Fe, PY–Fe, and SA–Fe complexes recorded in suspension at different pHs; table with the experimental vibrational frequencies of PY, GA, TA, and SA in solid state; corresponding complexes with Fe after drying on paper (PDF)
The authors declare no competing financial interest.
Supplementary Material
References
- Ferilli S. A Sentence Structure-Based Approach to Unsupervised Author Identification. J. Intell. Inf. Syst. 2016, 46, 1–19. 10.1007/s10844-014-0349-9. [DOI] [Google Scholar]
- Ezcurra M.; Góngora J. M. G.; Maguregui I.; Alonso R.. Analytical Methods for Dating Modern Writing Instrument Inks on Paper. In Forensic Science Interfaces .Elsevier Ireland Ltd, 2010, pp. 1–20, 10.1016/j.forsciint.2009.11.013. [DOI] [PubMed] [Google Scholar]
- Delange É.; Grange M.; Kusko B.; Menei E. Apparition de l’encre Métallogallique En Egypte à Partir de La Collection de Papyrus Du Louvre. Rev. Egyptol. 1990, 41, 213–217. 10.2143/RE.41.0.2011320. [DOI] [Google Scholar]
- Wunderlich C.-H.Geschichte Und Chemie Der Eisengallustinte; Rheinischen Friedrich-Wilhelms-Universität Bonn, Germany, 1990. [Google Scholar]
- Wunderlich C.-H.; Weber R.; Bergerhoff G. Über Eisengallustinte. Z. Anorg. Allg. Chem. 1991, 598, 371–376. 10.1002/ZAAC.19915980134. [DOI] [Google Scholar]
- Ponce A.; Brostoff L. B.; Gibbons S. K.; Zavalij P.; Viragh C.; Hooper J.; Alnemrat S.; Gaskell K. J.; Eichhorn B. Elucidation of the Fe(III) Gallate Structure in Historical Iron Gall Ink. Anal. Chem. 2016, 88, 5152–5158. 10.1021/acs.analchem.6b00088. [DOI] [PubMed] [Google Scholar]
- Goltz D. M. A Review of Instrumental Approaches for Studying Historical Inks. Anal. Lett. 2012, 45, 314–329. 10.1080/00032719.2011.644712. [DOI] [Google Scholar]
- Frühmann B.; Cappa F.; Vetter W.; Schreiner M.; Petrus F. Multianalytical Approach for the Analysis of the Codices Millenarius Maior and Millenarius Minor in Kremsmuenster Abbey, Upper Austria. Herit. Sci. 2018, 6, 1. 10.1186/s40494-018-0176-3. [DOI] [Google Scholar]
- Valadas S.; Freire R.; Cardoso A.; Mirão J.; Vandenabeele P.; Caetano J. O.; Candeias A. New Insight on the Underdrawing of 16th Flemish-Portuguese Easel Paintings by Combined Surface Analysis and Microanalytical Techniques. Micron 2016, 85, 15–25. 10.1016/j.micron.2016.03.004. [DOI] [PubMed] [Google Scholar]
- Díaz Hidalgo R. J.; Córdoba R.; Nabais P.; Silva V.; Melo M. J.; Pina F.; Teixeira N.; Freitas V. New Insights into Iron-Gall Inks through the Use of Historically Accurate Reconstructions. Herit. Sci. 2018, 6, 63. 10.1186/s40494-018-0228-8. [DOI] [Google Scholar]
- Daneshfar A.; Hashemi P.; Delfan B.; Tavakkoli M.; Rashno P. M. The Efficient Extraction of Phenolic Compounds from Oak Gall Using a Miniaturized Matrix Solid-Phase Dispersion Method before Their HPLC Determination. Herb. Med. J. Spring 2017, 2, 71–80. 10.22087/hmj.v0i0.615. [DOI] [Google Scholar]
- Zamorano G. M. C. The Presence of Iron in Inks Used in Valencian Manuscripts from the 13th to 17th Century. Microchem. J. 2018, 143, 484–492. 10.1016/j.microc.2018.07.043. [DOI] [Google Scholar]
- Contreras Zamorano G. M.; María G.. La Tinta de Escritura En Los Manuscritos de Archivo Valencianos, 1250-1600. Análisis, Identificación de Componentes y Valoración de Su Estado de Conservación, PhD diss., Universitat de València 2015. [Google Scholar]
- Nevin A.; Spoto G.; Anglos D. Laser Spectroscopies for Elemental and Molecular Analysis in Art and Archaeology. Appl. Phys. A: Mater. Sci. Process. 2012, 106, 339–361. 10.1007/s00339-011-6699-z. [DOI] [Google Scholar]
- Pessanha S.; Manso M.; Carvalho M. L. Application of Spectroscopic Techniques to the Study of Illuminated Manuscripts: A Survey. Spectrochim., Acta B 2012, 71-72, 54–61. 10.1016/j.sab.2012.05.014. [DOI] [Google Scholar]
- Duh J.; Krstić D.; Desnica V.; Fazinić S. Non-Destructive Study of Iron Gall Inks in Manuscripts. Nucl. Instrum. Methods Phys. Res., Sect. B 2018, 417, 96–99. 10.1016/j.nimb.2017.08.033. [DOI] [Google Scholar]
- Sánchez-Cortés S.; García-Ramos J. V. Adsorption and Chemical Modification of Phenols on a Silver Surface. J. Colloid Interface Sci. 2000, 231, 98–106. 10.1006/jcis.2000.7101. [DOI] [PubMed] [Google Scholar]
- Pompeu D. R.; Larondelle Y.; Rogez H.; Abbas O.; Pierna J. A. F.; Baeten V. Characterization and Discrimination of Phenolic Compounds Using Fourier Transform Raman Spectroscopy and Chemometric Tools. Biotechnol. Agron. Soc. Environ. 2018, 22, 13–28. 10.25518/1780-4507.16270. [DOI] [Google Scholar]
- Jaén J. A.; González L.; Vargas A.; Olave G.. Gallic Acid, Ellagic Acid and Pyrogallol Reaction with Metallic Iron. In Hyperfine Interactions; Springer Netherlands,2003; Vol. 148–149, pp. 227–235, 10.1023/B:HYPE.0000003784.88539.d4. [DOI] [Google Scholar]
- Creagh D.; Lee A.; Otieno-Alego V.; Kubik Recent and Future Developments in the Use of Radiation for the Study of Objects of Cultural Heritage Significance. Radiat. Phys. Chem. 2009, 367–374. 10.1016/j.radphyschem.2009.03.005. [DOI] [Google Scholar]
- Bioletti S.; Leahy R.; Fields J.; Meehan B.; Blau W. The Examination of the Book of Kells Using Micro-Raman Spectroscopy. J. Raman Spectrosc. 2009, 40, 1043–1049. 10.1002/jrs.2231. [DOI] [Google Scholar]
- Bruni S.; Caglio S.; Guglielmi V.; Poldi G. The Joined Use of n.i. Spectroscopic Analyses - FTIR, Raman, Visible Reflectance Spectrometry and EDXRF - To Study Drawings and Illuminated Manuscripts. Appl. Phys. A: Mater. Sci. Process. 2008, 92, 103–108. 10.1007/s00339-008-4454-x. [DOI] [Google Scholar]
- Carter E. A.; Perez F. R.; Garcia J. M.; Edwards H. G. M. Raman Spectroscopic Analysis of an Important Visigothic Historiated Manuscript. Philos. Trans. R. Soc. A Math. Phys. Eng. Sci. 2016, 2082, 20160041. 10.1098/rsta.2016.0041. [DOI] [PMC free article] [PubMed] [Google Scholar]
- Liu S.; Feng J.; Lv J.; Zhang W. Discrimination of Blue Ballpoint Pen Inks in Chinese Market with Confocal Raman Microscope. Pigment Resin Technol. 2014, 43, 45–51. 10.1108/PRT-12-2012-0089. [DOI] [Google Scholar]
- Lee A. S.; Otieno-Alego V.; Creagh D. C. Identification of Iron-Gall Inks with near-Infrared Raman Microspectroscopy. J. Raman Spectrosc. 2008, 39, 1079–1084. 10.1002/jrs.1989. [DOI] [Google Scholar]
- El Bakkali A.; Lamhasni T.; Haddad M.; Ait Lyazidi S.; Sanchez-Cortes S.; Del Puerto Nevado E. Non-Invasive Micro Raman, SERS and Visible Reflectance Analyses of Coloring Materials in Ancient Moroccan Islamic Manuscripts. J. Raman Spectrosc. 2013, 44, 114–120. 10.1002/jrs.4154. [DOI] [Google Scholar]
- Centeno S. A. Identification of Artistic Materials in Paintings and Drawings by Raman Spectroscopy: Some Challenges and Future Outlook. J. Raman Spectrosc. 2016, 47, 9–15. 10.1002/jrs.4767. [DOI] [Google Scholar]
- Gao J.; Yang X.; Yin W.; Li M. Gallnuts: A Potential Treasure in Anticancer Drug Discovery. J. Evidence-Based Complementary Altern. Med. 2018, 2018, 1. 10.1155/2018/4930371. [DOI] [PMC free article] [PubMed] [Google Scholar]
- Sylla T.; Pouységu L.; Dacosta G.; Deffieux D.; Monti J. P.; Quideau S. Gallotannins and Tannic Acid: First Chemical Syntheses and In Vitro Inhibitory Activity on Alzheimer’s Amyloid β-Peptide Aggregation. Angew. Chem., Int. Ed. 2015, 54, 8217–8221. 10.1002/ANIE.201411606. [DOI] [PubMed] [Google Scholar]
- Espina A.; Sanchez-Cortes S.; Jurašeková Z. Vibrational Study (Raman, SERS, and IR) of Plant Gallnut Polyphenols Related to the Fabrication of Iron Gall Inks. Mol. 2022, 27, 279. 10.3390/MOLECULES27010279. [DOI] [PMC free article] [PubMed] [Google Scholar]
- Frisch M. J.; Trucks G. W.; Schlegel H. B.; Scuseria G. E.; Robb M. A.; Cheeseman J. R.; Scalmani G.; Barone V.; Mennucci B.; Petersson G. A.; Nakatsuji H.; Caricato M.; Li X.; Hratchian H. P.; Izmaylov A. F.; Bloino J.; Zheng G.; Sonnenberg J. L.; Hada M.; Ehara M.; Toyota K.; Fukuda R.; Hasegawa J.; Ishida M.; Nakajima T.; Honda Y.; Kitao O.; Nakai H.; Vreven T.; Montgomery J. A.; Peralta J. E. Jr.; Ogliaro F.; Bearpark M.; Heyd J. J.; Brothers E.; Kudin K. N.; Staroverov V. N.; Kobayashi R.; Normand J.; Raghavachari K.; Rendell A.; Burant J. C.; Iyengar S. S.; Tomasi J.; Cossi M.; Rega N.; Millam J. M.; Klene M.; Knox J. E.; Cross J. B.; Bakken V.; Adamo C.; Jaramillo J.; Gomperts R.; Stratmann R. E.; Yazyev O.; Austin A. J.; Cammi R.; Pomelli C.; Ochterski J. W.; Martin R. L.; Morokuma K.; Zakrzewski V. G.; Voth G. A.; Salvador P.; Dannenberg J. J.; Dapprich S.; Daniels A. D.; Farkas O.; Foresman J. B.; Ortiz J. V.; Cioslowski J.; Fox D. J.. Gaussian 09, Revision A.02, Gaussian, Inc., Wallingford CT, 2016.
- Öhrström L.; Michaud-Soret I. Fe–Catecholate and Fe–Oxalate Vibrations and Isotopic Substitution Shifts from DFT Quantum Chemistry. J. Phys. Chem. A 1999, 103, 256–264. 10.1021/JP981508F. [DOI] [Google Scholar]
- Yapo-Kicho D.; Lagant P.; Vergoten G. The SPASIBA Force Field for Studying Iron-Tannins Interactions: Application to Fe 3+/Fe 2+ Catechol Complexes. Int. J. Mol. Sci. 2007, 8, 259–272. 10.3390/i8030259. [DOI] [Google Scholar]
- Hay P. J.; Wadt W. R. Ab Initio Effective Core Potentials for Molecular Calculations. Potentials for K to Au Including the Outermost Core Orbitals. J. Chem. Phys. 1998, 82, 299. 10.1063/1.448975. [DOI] [Google Scholar]
- Sánchéz-Cortés S.; García-Ramos J. V. FT Surface-Enhanced Raman Evidence of the Oxidative Condensation Reactions of Caffeic Acid in Solution and on Silver Surface. Appl. Spectrosc. 2000, 54, 230–238. 10.1366/0003702001949159. [DOI] [Google Scholar]
- Antosiewicz J. M.; Shugar D. UV–Vis Spectroscopy of Tyrosine Side-Groups in Studies of Protein Structure. Part 1: Basic Principles and Properties of Tyrosine Chromophore. Biophys. Rev. 2016, 8, 151. 10.1007/S12551-016-0198-6. [DOI] [PMC free article] [PubMed] [Google Scholar]
- Dearden J. C.; Forbes W. F. Light Absroption Studies Part XIV. The Ultraviolet Absorption Spectra of Phenols1. Can. J. Chem. 1959, 37, 1294. 10.1139/v59-193. [DOI] [Google Scholar]
- Ballesteros J. I.; Caleja-Ballesteros H. J. R.; Villena M. C. Digital Image-Based Method for Iron Detection Using Green Tea (Camellia Sinensis) Extract as Natural Colorimetric Reagent. Microchem. J. 2021, 160, 105652 10.1016/J.MICROC.2020.105652. [DOI] [Google Scholar]
- Elhabiri M.; Carrër C.; Marmolle F.; Traboulsi H. Complexation of Iron(III) by Catecholate-Type Polyphenols. Inorganica Chim. Acta 2007, 360, 353–359. 10.1016/J.ICA.2006.07.110. [DOI] [Google Scholar]
- Janssen R. H.; Canelli G.; Sanders M. G.; Bakx E. J.; Lakemond C. M. M.; Fogliano V.; Vincken J.-P. Iron-Polyphenol Complexes Cause Blackening upon Grinding Hermetia Illucens (Black Soldier Fly) Larvae. Sci. Rep. 2019, 9, 2967. 10.1038/s41598-019-38923-x. [DOI] [PMC free article] [PubMed] [Google Scholar]
- Nkhili E.; Loonis M.; Mihai S.; El Hajji H.; Dangles O. Reactivity of Food Phenols with Iron and Copper Ions: Binding, Dioxygen Activation and Oxidation Mechanisms. Food Funct. 2014, 5, 1186–1202. 10.1039/C4FO00007B. [DOI] [PubMed] [Google Scholar]
- Alvarez-Ros M. C.; Sánchez-Cortés S.; Francioso O.; García-Ramos J. V. Catalytic Modification of Gallic Acid on a Silver Surface Studied by Surface-Enhanced Raman Spectroscopy. J. Raman Spectrosc. 2001, 32, 143–145. 10.1002/jrs.683. [DOI] [Google Scholar]
- Bijlsma J.; de Bruijn W. J. C.; Hageman J. A.; Goos P.; Velikov K. P.; Vincken J. P. Revealing the Main Factors and Two-Way Interactions Contributing to Food Discolouration Caused by Iron-Catechol Complexation. Sci. Rep. 2020, 10, 1–11. 10.1038/s41598-020-65171-1. [DOI] [PMC free article] [PubMed] [Google Scholar]
- Karpishin T. B.; Gebhard M. S.; Solomon E. I.; Raymond K. N. Spectroscopic Studies of the Electronic Structure of Iron(III) Tris(Catecholates). J. Am. Chem. Soc. 2002, 113, 2977–2984. 10.1021/JA00008A028. [DOI] [Google Scholar]
- Varsányi G.Vibrational Spectra of Benzene Derivatives; Academic Press: New York, 1969. [Google Scholar]
- Lee A. S.; Mahon P. J.; Creagh D. C. Raman Analysis of Iron-Gall Inks on Parchment. Vib. Spectrosc. 2006, 41, 170–175. 10.1016/J.VIBSPEC.2005.11.006. [DOI] [Google Scholar]
- Yardley J. T.; Hagadorn A. Characterization of the Chemical Nature of the Black Ink in the Manuscript of the Gospel of Jesus’s Wife through Micro-Raman Spectroscopy. Harv. Theol. Rev. 2014, 107, 162–164. 10.1017/S0017816014000157. [DOI] [Google Scholar]
- Edwards H. G. M.Analytical Raman Spectroscopy of Inks; Royal Society of Chemistry, 2018; pp. 1–15, 10.1039/9781788013475-00001. [DOI] [Google Scholar]
- Nastova I.; Grupče O.; Minčeva-Šukarova B.; Turan S.; Yaygingol M.; Ozcatal M.; Martinovska V.; Jakovlevska-Spirovska Z. Micro-Raman Spectroscopic Analysis of Inks and Pigments in Illuminated Medieval Old-Slavonic Manuscripts. J. Raman Spectrosc. 2012, 43, 1729–1736. 10.1002/jrs.4084. [DOI] [Google Scholar]
- Burgio L.; Clark R. J. H.; Hark R. R. Raman Microscopy and X-Ray Fluorescence Analysis of Pigments on Medieval and Renaissance Italian Manuscript Cuttings. Proc. Natl. Acad. Sci. U. S. A. 2010, 107, 5726–5731. 10.1073/pnas.0914797107. [DOI] [PMC free article] [PubMed] [Google Scholar]
- Salama S.; Stong J. D.; Spiro T. G.; Neilands J. B. Electronic and Resonance Raman Spectra of Iron(III) Complexes of Enterobactin, Catechol, and N-Methyl-2,3-Dihydroxybenzamide. Biochemistry 1978, 17, 3781–3785. 10.1021/bi00611a017. [DOI] [PubMed] [Google Scholar]
- Wrzalik R.; Merkel K.; Kocot A. Ab Initio Study of Phenyl Benzoate: Structure, Conformational Analysis, Dipole Moment, IR and Raman Vibrational Spectra. J. Mol. Model. 2003, 9, 248–258. 10.1007/s00894-003-0138-9. [DOI] [PubMed] [Google Scholar]
- Bicchieri M.; Monti M.; Piantanida G.; Sodo A. Non-Destructive Spectroscopic Investigation on Historic Yemenite Scriptorial Fragments: Evidence of Different Degradation and Recipes for Iron Tannic Inks. Anal. Bioanal. Chem. 2013, 405, 2713–2721. 10.1007/s00216-012-6681-4. [DOI] [PubMed] [Google Scholar]
- Bagheri M.; Jafari S. M.; Eikani M. H. Development of Ternary Nanoadsorbent Composites of Graphene Oxide, Activated Carbon, and Zero-Valent Iron Nanoparticles for Food Applications. Food Sci. Nutr. 2019, 7, 2827–2835. 10.1002/fsn3.1080. [DOI] [PMC free article] [PubMed] [Google Scholar]
- Singh K. K.; Senapati K. K.; Sarma K. C. Synthesis of Superparamagnetic Fe3O4 Nanoparticles Coated with Green Tea Polyphenols and Their Use for Removal of Dye Pollutant from Aqueous Solution. J. Environ. Chem. Eng. 2017, 5, 2214–2221. 10.1016/j.jece.2017.04.022. [DOI] [Google Scholar]
- Krekel C. NCJRS Abstract - National Criminal Justice Reference Service. Int. J. Forensic Doc. Exam. 1999, 5, 54–58. [Google Scholar]
- Lerf A.; Wagner F. E.; Dreher M.; Espejo T.; Pérez-Rodríguez J. L. Mössbauer Study of Iron Gall Inks on Historical Documents. Herit. Sci. 2021, 9, 1–14. 10.1186/S40494-021-00522-3/FIGURES/6. [DOI] [Google Scholar]
- Rahim M. A.; Kempe K.; Müllner M.; Ejima H.; Ju Y.; Van Koeverden M. P.; Suma T.; Braunger J. A.; Leeming M. G.; Abrahams B. F.; et al. Surface-Confined Amorphous Films from Metal-Coordinated Simple Phenolic Ligands. Chem. Mater. 2015, 27, 5825–5832. 10.1021/acs.chemmater.5b02790. [DOI] [Google Scholar]
- Gonçalves N. S.; Horn A.; Lanznaster M.; Noda L. K.; Neves A. Resonance Raman Spectroscopy of FeIIFeIII and Fe IIIFeIII Model Complexes Containing an Unsymmetrical Dinucleating Ligand: A Biomimetic Redox Pair for Uteroferrin. J. Braz. Chem. Soc. 2006, 17, 1658–1663. 10.1590/s0103-50532006000800025. [DOI] [Google Scholar]
- Perron N. R.; Brumaghim J. L. A Review of the Antioxidant Mechanisms of Polyphenol Compounds Related to Iron Binding. Cell Biochem. Biophys. 2009, 53, 75–100. 10.1007/S12013-009-9043-X. [DOI] [PubMed] [Google Scholar]
- Falcão L.; Araújo M. E. M. Vegetable Tannins Used in the Manufacture of Historic Leathers. Mol. A J. Synth. Chem. Nat. Prod. Chem. 2018, 23, 2014. 10.3390/MOLECULES23051081. [DOI] [PMC free article] [PubMed] [Google Scholar]
- Ricci A.; Olejar K. J.; Parpinello G. P.; Kilmartin P. A.; Versari A. Application of Fourier Transform Infrared (FTIR) Spectroscopy in the Characterization of Tannins. Appl. Spectrosc. Rev. 2015, 50, 407–442. 10.1080/05704928.2014.1000461. [DOI] [Google Scholar]
- Garrido C.; Diaz-Fleming G.; Campos-Vallette M. M. SERS Spectrum of Gallic Acid Obtained from a Modified Silver Colloid. Spectrochim. Acta. A. Mol. Biomol. Spectrosc. 2016, 163, 68–72. 10.1016/J.SAA.2016.03.028. [DOI] [PubMed] [Google Scholar]
- Danilewicz J. C.; Tunbridge P.; Kilmartin P. A. Wine Reduction Potentials: Are These Measured Values Really Reduction Potentials?. J. Agric. Food Chem. 2019, 67, 4145–4153. 10.1021/ACS.JAFC.9B00127. [DOI] [PubMed] [Google Scholar]
- Elias R. J.; Waterhouse A. L. Controlling the Fenton Reaction in Wine. J. Agric. Food Chem. 2010, 58, 1699–1707. 10.1021/JF903127R. [DOI] [PubMed] [Google Scholar]
- El Hajji H.; Nkhili E.; Tomao V.; Dangles O. Interactions of Quercetin with Iron and Copper Ions: Complexation and Autoxidation. Free Radical Res. 2006, 40, 303–320. 10.1080/10715760500484351. [DOI] [PubMed] [Google Scholar]
- Welch K. D.; Davis T. Z.; Aust S. D. Iron Autoxidation and Free Radical Generation: Effects of Buffers, Ligands, and Chelators. Arch. Biochem. Biophys. 2002, 397, 360–369. 10.1006/ABBI.2001.2694. [DOI] [PubMed] [Google Scholar]
- Chvátalová K.; Slaninová I.; Březinová L.; Slanina J. Influence of Dietary Phenolic Acids on Redox Status of Iron: Ferrous Iron Autoxidation and Ferric Iron Reduction. Food Chem. 2008, 106, 650–660. 10.1016/J.FOODCHEM.2007.06.028. [DOI] [Google Scholar]
- Danilewicz J. C. Role of Tartaric and Malic Acids in Wine Oxidation. J. Agric. Food Chem. 2014, 62, 5149–5155. 10.1021/JF5007402. [DOI] [PubMed] [Google Scholar]
- Espadaler I.; Sistach M. C.; Cortina M.; Eljarrat E.; Alcaraz R.; Cabanas J. Organic and Inorganic Components of Manuscript Inks. An. Química 1995, 91, 359–364. 10.1016/j.vibspec.2021.103232. [DOI] [Google Scholar]
- Feller R. K.; Cheetham A. K. Fe(III), Mn(II), Co(II), and Ni(II) 3,4,5-Trihydroxybenzoate (Gallate) Dihydrates; a New Family of Hybrid Framework Materials. Solid State Sci. 2006, 8, 1121–1125. 10.1016/J.SOLIDSTATESCIENCES.2006.04.013. [DOI] [Google Scholar]
- Sánchez-Cortés S.; Francioso O.; García-Ramos J.; Ciavatta C.; Gessa C. Catechol Polymerization in the Presence of Silver Surface. Colloids Surf., A 2001, 176, 177–184. 10.1016/S0927-7757(00)00630-0. [DOI] [Google Scholar]
- Rashad M.; Rüsing M.; Berth G.; Lischka K.; Pawlis A. CuO and Co3O4 Nanoparticles: Synthesis, Characterizations, and Raman Spectroscopy. J. Nanomater. 2013, 2013, 1. 10.1155/2013/714853. [DOI] [Google Scholar]
Associated Data
This section collects any data citations, data availability statements, or supplementary materials included in this article.