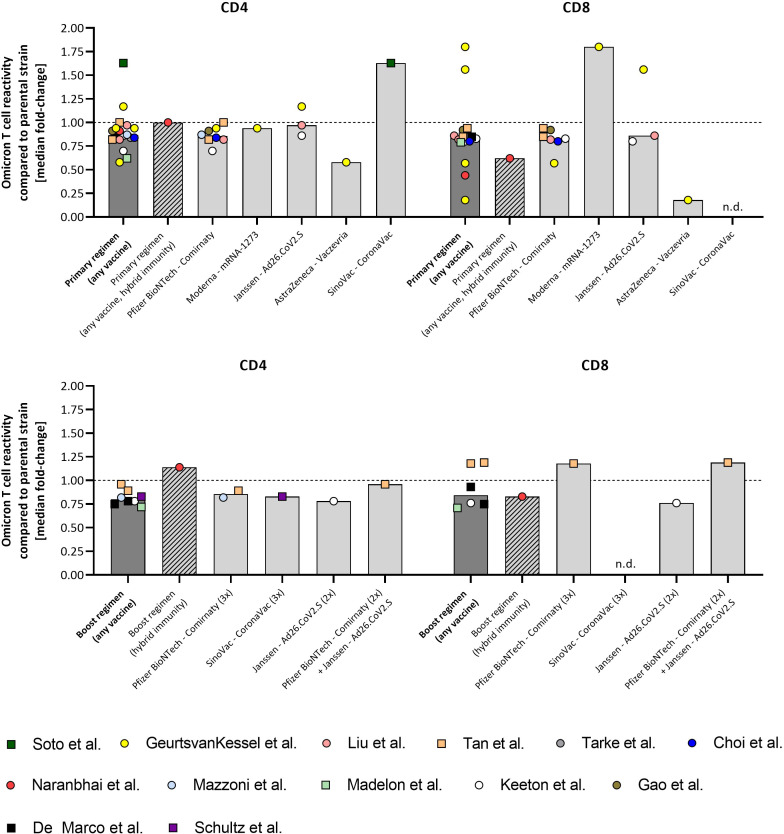
Figure 1.
Overview of study results on omicron-specific T cell reactivity compared to the parental strain of SARS-CoV-2. Study results from 13 studies assessing omicron-specific T cell reactivity available by March 31st, 2022, are shown as fold-change compared to parental-specific T cell activation. Non peer-reviewed pre-prints are shown as squares. A) Data on primary vaccine regimen and B) data on booster regimen. Every data point represents a single study. Data points from the same study are depicted with the same color. Data are either presented within the manuscript or abstracted from high-resolution figures or raw data provided with the manuscript. “Primary regimen (any vaccine)” and “Boost regimen (any vaccine) show all data points from studies on primary or boost vaccine cohorts, respectively (dark grey bars), excluding hybrid immunity shown in a separate bar (shaded bars). Data are not stratified for sampling intervals and peak-immunity as well as waned immunity data sets are included. Bars indicate the median fold-change in T cell cross-reactivity to omicron, compared to the parental strain. N.d, no data.

