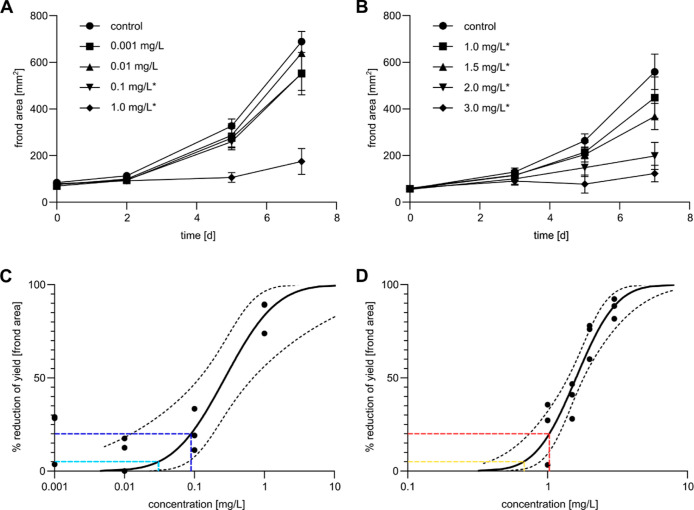
Figure 2.
Pretest for detecting ECs of atorvastatin and bentazon according to OECD TG 221. (A,B) Time-dependent course of the frond area at different exposure concentrations of atorvastatin (A) and bentazon (B). Statistically significant changes at day 7 compared to the control are indicated by an asterisk (Williams Multiple Sequential t-test). The standard deviation is given as an error bar. (C,D) Concentration–response curve of frond area yields reduction after exposure to atorvastatin (C) and bentazon (D) on day 7. The EC5 is colored in light blue and yellow, and the EC20 is colored in dark blue and red.

