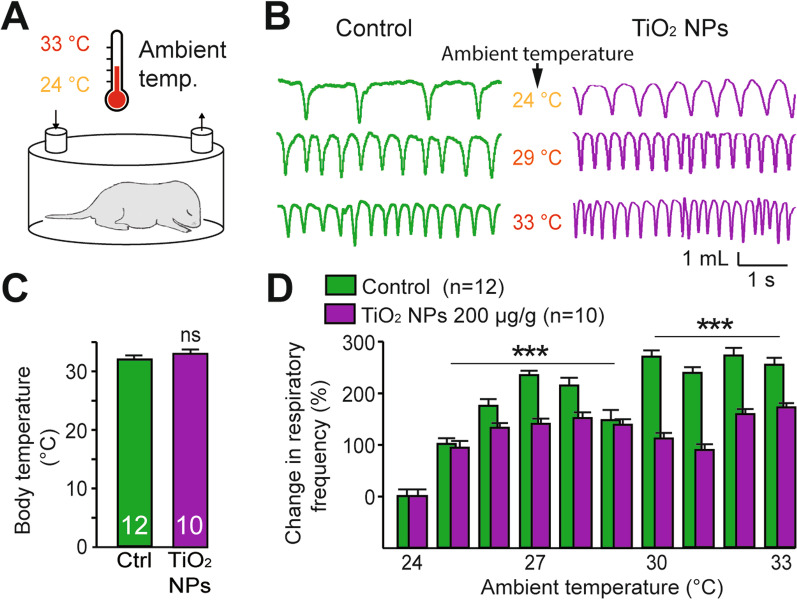
Fig. 7.
In vivo effect of temperature on breathing rate in unexposed and prenatally TiO2 NP-exposed neonates. A Schematic of experimental procedure. B Whole-body plethysmographic recordings of non-exposed (Control, green traces) and TiO2 NP (200 µg/g)-exposed offspring (purple traces) under different ambient temperature conditions (indicated between traces). C Bar charts showing values of body temperature under standard room temperature in control (green bar) and TiO2 NP (200 µg/g)-exposed offspring (purple bar). D Bar charts illustrating changes in spontaneous breathing frequency (mean ± SEM) in control (green bars) and prenatally TiO2 NP-exposed (purple bars) groups under the warming protocol. Data were pooled from P0 to P3. ***p < 0.001; ns, not statistically significant

