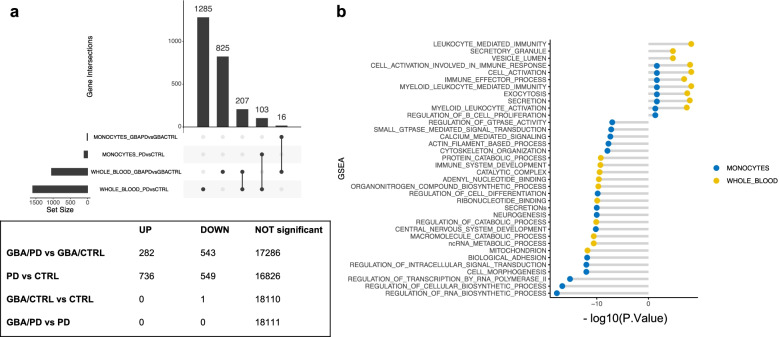
Fig. 4.
Differential expression profiles in whole blood and overlap with monocytes data. a Upset plot summarizing the number of differentially expressed genes at FDR < 0.05 in whole blood between manifesting and non-manifesting GBA carriers, and PD and CTRL subjects and the overlapping genes with monocytes. b Number of DEG across groups in whole blood (UP = upregulated genes, DOWN: downregulated genes). c Dysregulated pathways in CD14+ monocytes and whole blood in GBA/PD vs GBA/CTRL. The plot represent the -log10(P Value) the enriched pathways in the differentially up-regulated and down-regulated genes when comparing GBA/PD vs GBA/CTRL in both isolated CD14+ monocytes (blue) and whole blood (yellow) at FDR 5%. The figure shows an overlap in monocytes and whole blood of the upregulated pathways related to membrane trafficking and immune response

