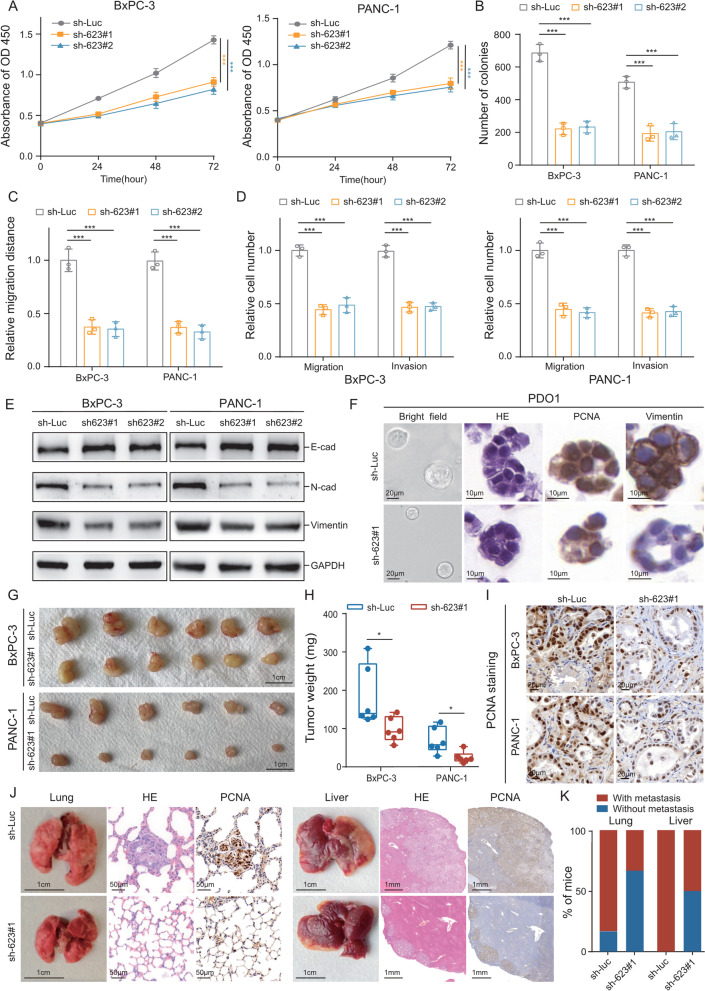
Fig. 2.
LINC00623 enhanced the proliferation, migration and invasion abilities of PDAC cells in vitro and in vivo. a CCK-8 assays were used to determine the cell proliferation rates. b The results of quantitative analysis of foci numbers are summarized in the bar chart. c The relative migration distance of the indicated cells was determined in the wound healing assay. d The relative numbers of migrated and invaded cells in the indicated groups in the Transwell migration and invasion assays are summarized in the bar chart. Cells transfected with control plasmids were used as controls. a–d The values indicate the mean ± SD of three independent experiments. P values are shown as *P < 0.05, **P < 0.01, or *** P < 0.001. Independent Student’s t test. e The protein expression levels of E-cadherin, N-cadherin and Vimentin in BxPC-3 and PANC-1 cells were determined by Western blotting. GAPDH was used as the loading control. f Representative images of H&E staining and IHC staining of PDO1. PDO1 was transiently transfected with the LINC00623 shRNA or control plasmid. Antibodies against PCNA and Vimentin were used in the IHC assays. g Representative images of subcutaneous tumors formed by the indicated cells. h Tumor weights are expressed as the mean ± SD of six mice (*P < 0.05, independent Student’s t test). i Representative images of IHC staining with anti-PCNA antibody in tumors formed by the indicated cells. j Two in vivo metastasis assays were performed by tail vein injection (left) and splenic injection (right) to evaluate the effect of LINC00623 knockdown on tumor metastasis. Representative images of excised lungs and livers and of H&E staining and IHC staining with an anti-PCNA antibody in metastatic tumors formed by BxPC-3 cells. k The frequency of tumor metastasis in each group is summarized in the bar chart

