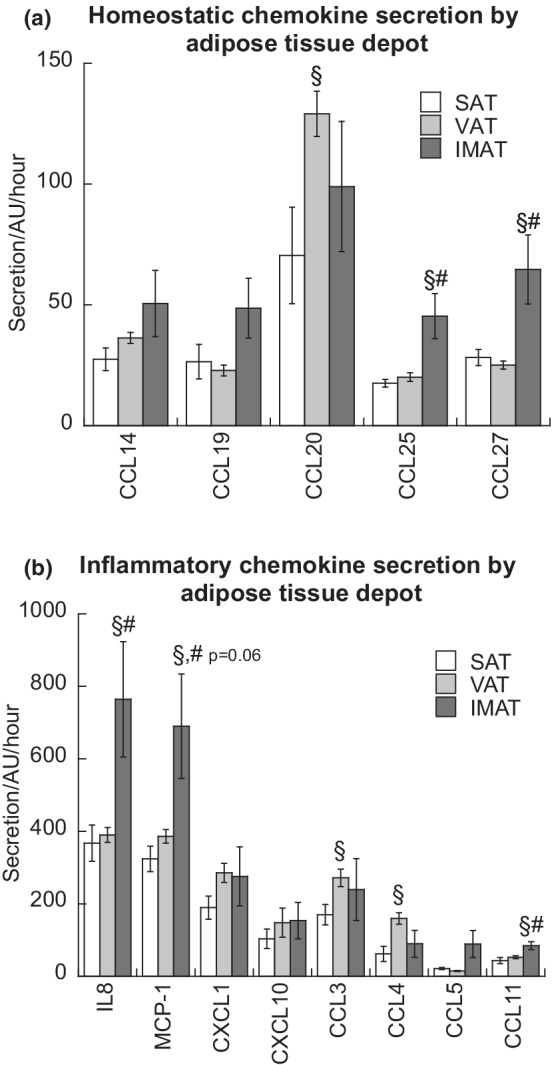
FIGURE 2.

Homeostatic chemokine (a) and inflammatory chemokine (b) secretion from SAT, VAT, and IMAT. Values are means ± SEM. §Significantly different than SAT, #Significantly different that VAT, p < 0.05. IMAT, intermuscular adipose tissue; SAT, subcutaneous adipose tissue; VAT, visceral adipose tissue
