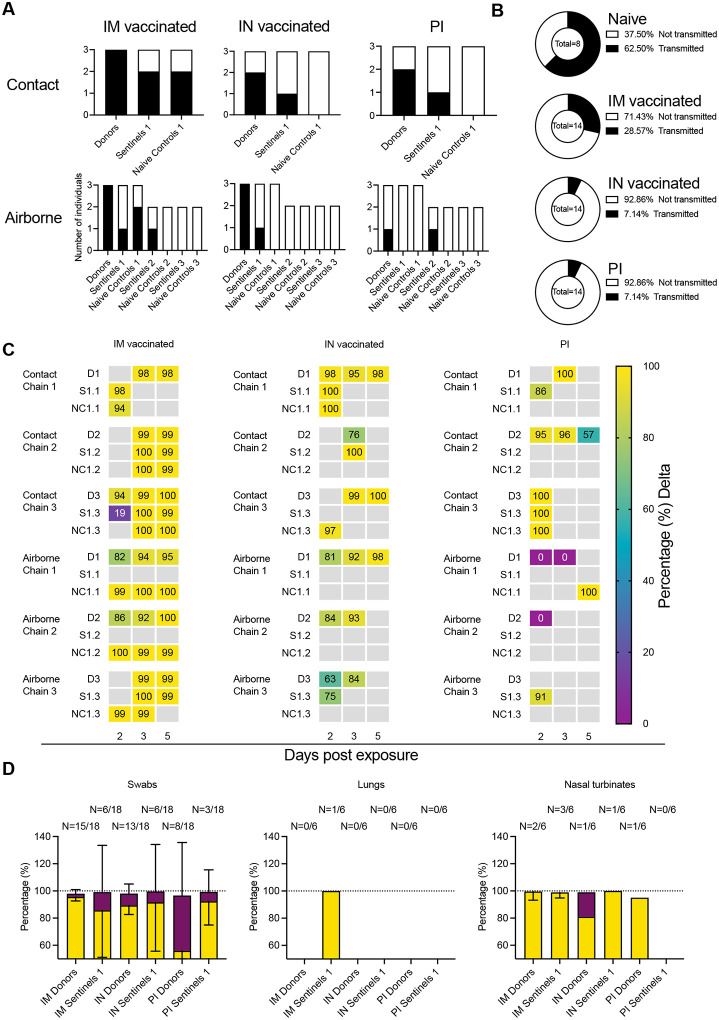
Figure 5. Transmission competitiveness of Delta and Omicron in animal groups with pre-existing immunity.
Transmission efficiency and viral competitiveness in IN or IM vaccinated and PI hamsters. A. Summary of infection status for donors and sentinels. Oropharyngeal swabs were taken on 2, 3, and 5 DPI/DPE, and lungs and nasal turbinates collected at 5 DPI/DPE. Individuals were considered infected, if 2/5 samples were positive for sgRNA. Bar charts depict summary of individuals, divided by contact and airborne chains. B. Pie charts summarizing transmission efficiency between naïve, IM vaccinated, IN vaccinated, and PI hamsters across all airborne transmission events. Number of events is indicated within each pie chart. Colors refer to legends on right. C. The receptor binding domain of the SARS-CoV-2 spike was sequenced for all sgRNA positive swab samples taken on 2, 3, and 5 DPI/DPE. Heatmap displaying all sgRNA positive samples from each individual for each chain and showing percentage of Delta detected. Colors refer to legend on right (D = donor, S = sentinel, NC = naïve control), grey = no sgRNA present in the sample or sequencing unsuccessful. D. Overall percentage of Delta and Omicron in all sgRNA positive samples in each group, separated by sample type. Bar charts depicting mean and 95% CI. Number of sgRNA positive samples over all samples analyzed is indicated on top. Yellow = Delta, purple = Omicron.

