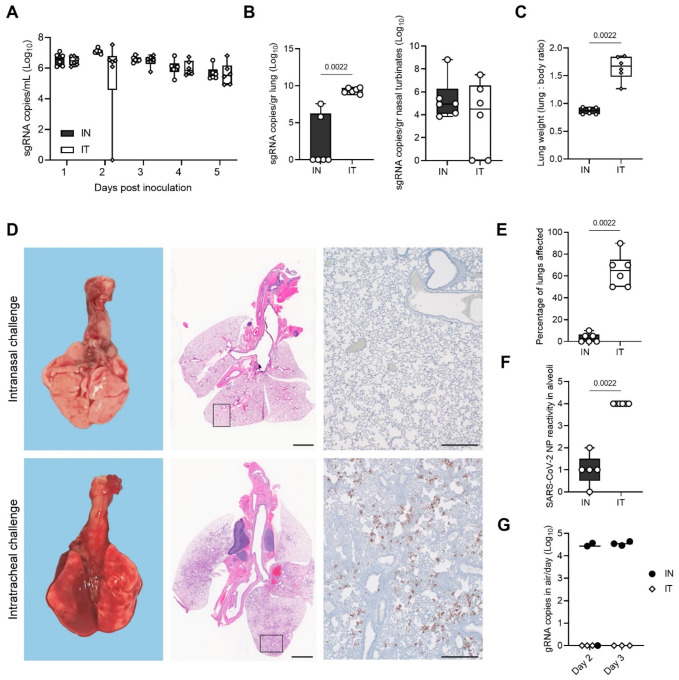
Figure 6. Recovery of lower respiratory tract replication and pathogenicity using intratracheal inoculation with Omicron.
Syrian hamsters were inoculated with Omicron through the intranasal (IN) or intratracheal (IT) route (group size N = 6). Shedding and virus titers in tissues at 5 DPE were compared. A. Viral load as measured by sgRNA in oropharyngeal swabs collected at 1–5 days post inoculation. Whisker-plots depicting median, min and max values, and individual values, N = 6. B. sgRNA in lungs and nasal turbinates. Whisker-plots depicting median, min and max values, and individual values. Kruskal-Wallis test, N = 6. C. Lung weights (lung : body ratio). Whisker-plots depicting median, min and max values, and individual values, Kruskal-Wallis test, N = 6. D. Gross pathology of lungs on IN (top) and IT (bottom) inoculated animals at 5 DPE (left), histopathology (HE, middle), and immunohistochemistry against SARS-COV-2 NP (IHC, 200x, right) E. Percentage of lungs affected. F. Quantitative analysis of the NP reactivity. Whisker-plots depicting median, min and max values, and individual values. Kruskal-Wallis test, N = 6. G. For each airborne transmission, cage air was sampled in 24h intervals. Measurement of each individual cage is shown for gRNA. black = IN, white = IT. P-values stated were significant (<0.05).

