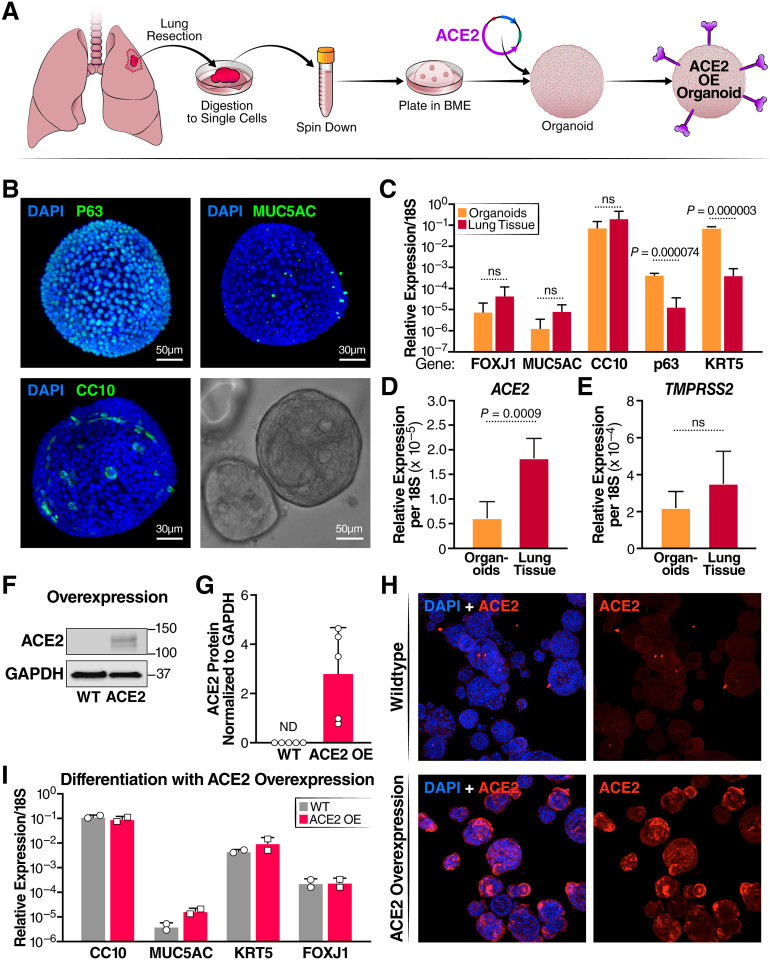
Figure 1: Characterization of human airway organoids (HAOs) and overexpression of ACE2.
(A) Schematic detailing the establishment of organoid culture and ACE2 overexpression. (B) Light sheet microscopy of HAOs with staining for the cell markers CC10 (club cells) MUC5AC (goblet cells) and p63 (basal cells) with a brightfield image of a single organoid in the lower right-hand corner. (C) RT- qPCR comparison of cell-marker gene expression between digested primary lung tissue and organoids, (N = 3, organoids, N = 4, input, +/− SD shown). (D) RT-qPCR comparing ACE2 expression level between organoids and digested lung tissue. (E) RT-qPCR comparing TMPRSS2 expression level between organoids and digested lung tissue (N = 3, organoids, N = 4, input, +/− SD shown). (F) Representative western blot showing ACE2 protein levels in organoids at baseline and with ACE2 overexpression. (G) Quantification of ACE2 protein levels in wildtype organoids and organoids overexpressing ACE2. (H) Confocal imaging comparing ACE2 expression levels in wildtype and ACE2-overexpressing organoids. (I) RT-qPCR comparison of cell-marker genes after differentiation at the air-liquid interface of wildtype and ACE2 overexpressing organoids (N = 2, +/− SD shown).

