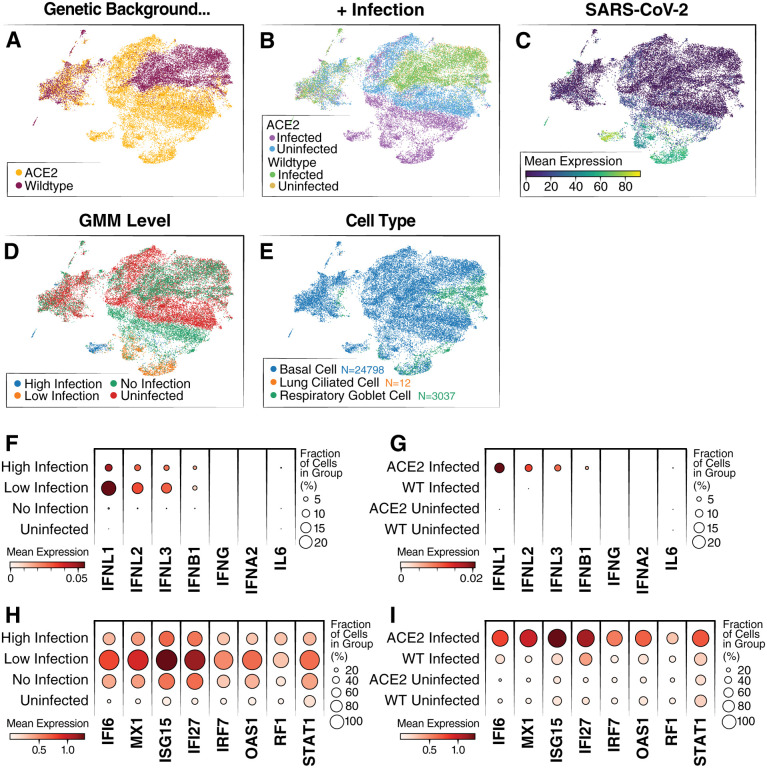
Figure 3: Single-cell RNA-sequencing of WT and ACE2 OE organoids infected with SARS-CoV-2.
(A) UMAP colored by overexpression condition of organoids. (B) UMAP colored by overexpression condition and infection condition. (C) UMAP colored by log expression of SARS-CoV-2 RNA. (D) UMAP colored by GMM infection classification. (E) UMAP colored by cell type identification. (F) Dot plot showing levels of interferon genes and IL-6 RNA grouped by infection level. (G) Dot plot showing levels of interferon genes and IL-6 grouped by overexpression condition. (H) Dot plot showing levels of top differentially expressed ISGs grouped by infection level. ISGs were selected from the list of top 50 differentially expressed genes between the high-infected and uninfected cells. (I) Dot plot showing levels of top differentially expressed ISGs grouped by overexpression background.

