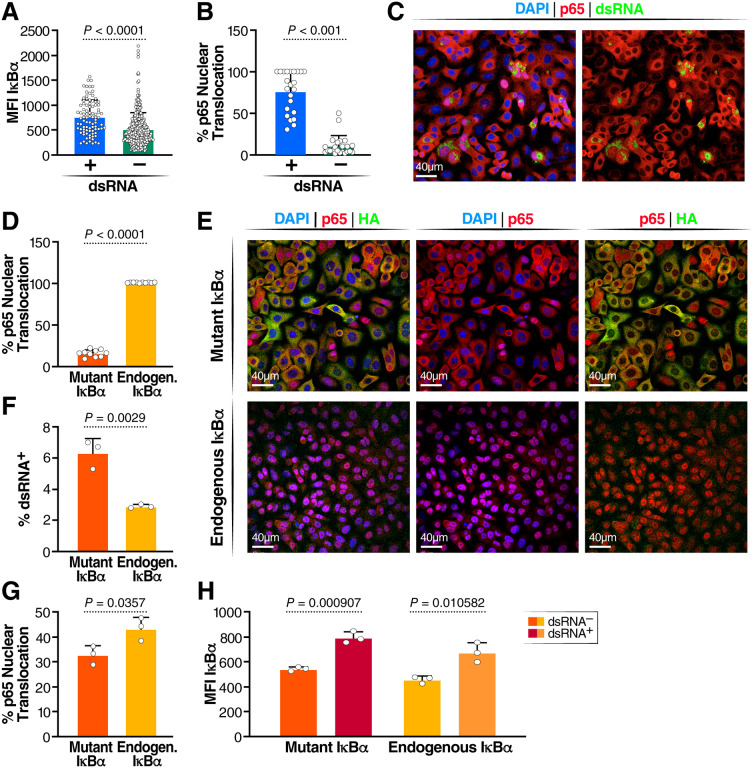
Figure 5: Role of IκBα in SARS-CoV-2 infection.
(A) Quantification of p65 translocation in SARS-CoV-2 infected dsRNA+ and dsRNA− A549-ACE2 cells (n = 2) (B) Representative image of p65 translocation (C) Quantification if MFI of IκBα in dsRNA+ and dsRNA- cells (D) Representative image of IκBα and dsRNA staining in SARS-CoV-2 infected A549-ACE2 cells (E) Quantification of p65 translocation in cells expressing phosphorylation resistant IκBα after stimulation with TNFα and cells with functional IκBα. Three replicates were done, and a minimum of 5,000 cells were analyzed per condition; standard deviation is indicated (F) Representative images of DAPI, p65 and HA staining after TNFα stimulation (G) Quantification of dsRNA in mutant and non-mutant IκBα A549-ACE2 lines (G) Quantification of dsRNA in mutant and non-mutant IκBα A549-ACE2 lines. Three replicates were done, and a minimum of 5,000 cells were analyzed per condition; standard deviation is indicated (H) Quantification of p65 translocation in mutant and non-mutant IκBα A549-ACE2 lines (I) Quantification of IκBα MFI in mutant and non-mutant IκBα A549-ACE2 lines.

