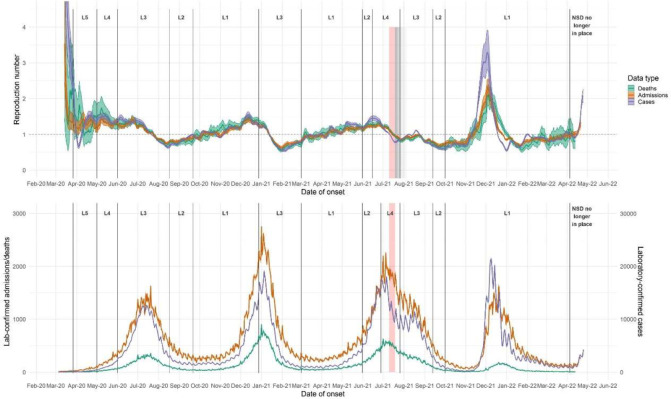
Figure 1:
(upper panel) R estimates for each data endpoint, South Africa, based on (lower panel) national daily time series of rt-PCR-confirmed cases, hospitalisations, and deaths. R estimated using 7-day sliding windows, from early March 2020 through through 25 April. Results reflect median values (between imputations) of median R estimates and associated 2.5% and 97.5% credible intervals. L = Level. Red shaded areas indicate the period during which civil unrest caused severe disruptions to surveillance in KwaZulu-Natal and Gauteng provinces; grey shaded areas indicate gradually diminishing effects on R estimates.

