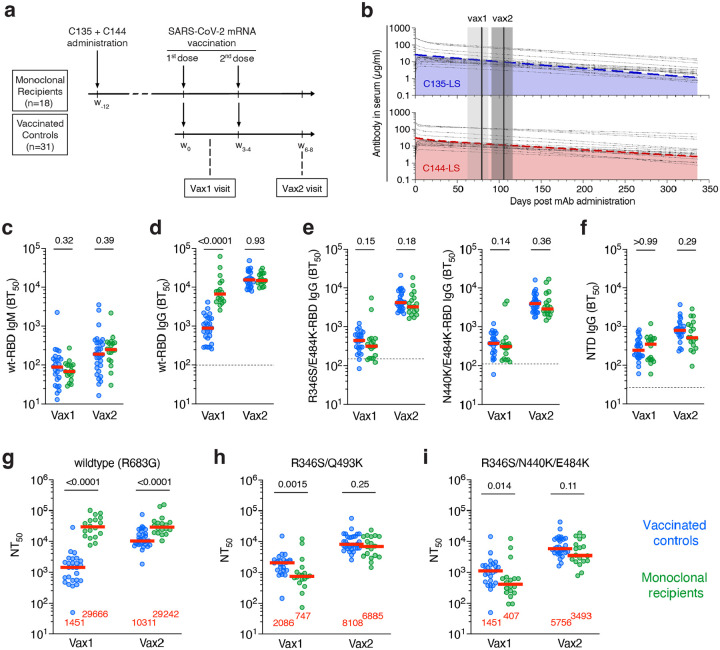
Fig. 1: Study design and plasma antibody activity.
a, Schematic overview of the study design with markers (w) denoting weeks relative to the time of the first vaccine dose. b, Serum levels of C135-LS (upper panel, in blue) and C144-LS (lower panel, in red) over time are shown. The thick colored dashed lines indicate the median serum concentrations among mAb recipients (n=18), while the thin dotted black lines represent individual participants. The two solid vertical lines indicate the median and the grey shaded areas the range of time from mAb administration. c-f, Half-maximal plasma binding titers (BT50) to RBD after one (vax1) and two doses (vax2) mRNA vaccinations for monoclonal antibody recipients (n=18, in green) and controls (n=26, in blue). Each dot represents one individual. Dashed horizontal lines represent the median binding activity of healthy pre-pandemic plasma samples, which served as negative controls. c,d, IgM (c) and IgG (d) binding titers to WT RBD. e, IgG binding to R346S/E484K (left panel) and N440K/E484K RBDs, see also Ext. Data Fig 1. f, IgG binding to the NTD. g-i, Plasma half-maximal neutralizing titers (NT50s) against HIV-1 pseudotyped with g, SARS-CoV-2 WT S. h, R346S/Q493K mutant S. (i) R346S/N440K/E484K mutant S (see also Ext. Data Fig 2). The S protein in the pseudoviruses in g-i contained an R683G substitution. Red horizontal bars in c-i and red numbers in g-i represent median values. Statistical significance in c-i was determined using the two-tailed Mann-Whitney test comparing differences between monoclonal recipients and controls for each time point independently. All experiments were performed at least in duplicate.

