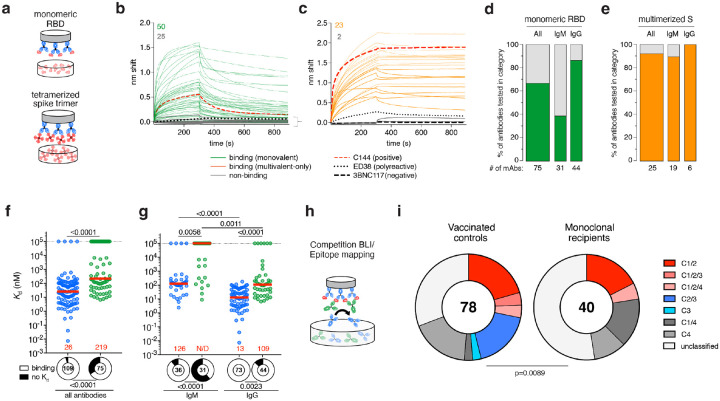
Fig. 4: Affinities and epitope distribution of anti-SARS-CoV-2 RBD memory antibodies from vaccinated mAb recipients.
a-g, Monoclonal antibody binding to monomeric and multimerized antigen by BLI. a, Schematic representation for monomeric binding measurements where IgG is immobilized on the biosensor chip and subsequently exposed to monomeric RBD (upper panel), and multimeric binding using 6P-stabilized WT SARS-CoV-2 S protein trimers that had been tetramerized using streptavidin (lower panel). b, Graphs show BLI traces obtained under monovalent conditions. Each curve represents one antibody. Colored solid lines denote binding above background represented by polyreactive antibody ED3828 (dotted black line) and anti-HIV-1 antibody 3BNC117 (dashed black line). Grey lines show non-binding antibodies. C144 (thick, red-dashed line) is a positive control. Colored and grey numbers in upper left of each panel indicate the number of binding and non-binding antibodies, respectively. c, As in (b) for antibodies that showed no measurable binding in (b) and were subsequently tested for binding under polyvalent conditions. d, Bar charts show the percentage of binding antibodies under monovalent conditions for all antibodies and by isotype. Values below bars indicate the number of antibodies tested. e, as in (d) for antibodies shown in (c). f, Graphs show affinity constants (Kd) derived under monomeric binding conditions (b) for mAb recipients (green) and controls (blue) irrespective of isotype. Ring plots illustrate the fraction of antibodies tested for the respective group (encircled number) that measurably bound to monomeric RBD (“binding”, in white) and those for which a Kd value could not be established (“no Kd”, black). Red horizontal bars and numbers represent median values (N/D, not determined). g, as in (f) analyzed independently for IgM and IgG. h, Schematic representation of BLI competition experiment in which a capture antibody of known epitope-specificity (class-reference antibody) is bound to the biosensor chip and exposed to antigen. In a second step, the antibody of interested is added to the chip. i, Pie charts show the distribution of epitopes targeted. The number in the center is the number of antibodies tested. Slices colored in shades of red and blue represent Class 1, 2 and 3 or combined epitopes, shades of grey represent Class 4-containing epitopes or epitopes that could not be classified by this method. Statistical significance was determined using the two-tailed Mann-Whitney test for f, and the Kruskal-Wallis test with subsequent Dunn’s correction for multiple comparisons for g. To compare categories and distributions from ring plots, Fisher’s exact test was used for f and g, and the Chi-squared contingency statistic was used for panel i.

