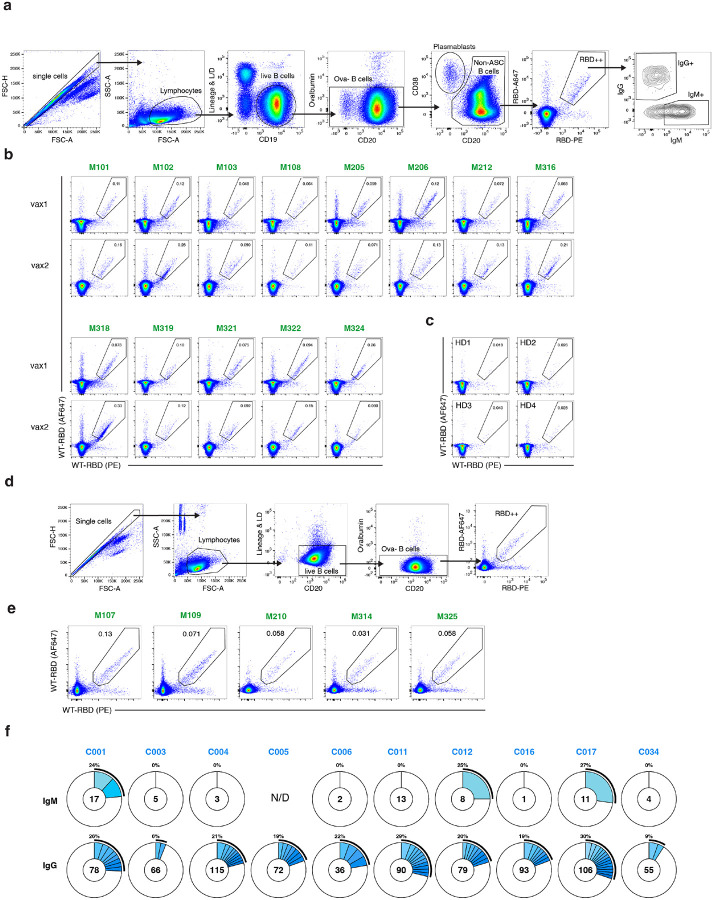
Extended Data Fig. 3: Flow cytometry, single-cell sorting and BCR sequencing.
a, Gating strategy for flow-cytometry phenotyping. Gating was on single lymphocytes that were CD19+ and CD20+, and CD3− CD8− CD16− Ova− without uptake of live-dead dye (L/D). Antigen-specific cells were those with dual binding to Wuhan-Hu1 RBD-PE and RBD-AF647. Anti-IgG, -IgM were used to phenotype dual RBD-labelled B cells. b,c, Representative flow cytometry plots of Wuhan Hu-1 RBD-binding memory B cells from 13 mAb recipients after one and two doses of vaccination (b) and pre-pandemic health donors (c) serving as negative controls. Numbers in RBD-gate denote percentage of RBD dual-labelled cells of parent gate (see a). Corresponding flow-cytometry plots and gating strategy for vaccinated controls can be found in10 d, Gating strategy for single-cell sorting of RBD-specific memory B cells. Dual-labelled (RBD-PE+/−AF647+) CD20+ CD3− CD8− CD16− Ova− cells were sorted. e, Representative flow cytometry plots show RBD-binding cells that were sorted from 5 mAb recipients (Fig. 2g). f, Pie charts show the distribution of antibody sequences derived from cells isolated from 10 vaccinated control individual after vax2 (Fig 2h). The upper panel shows IgM, and the lower panel depicts IgG sequences10,11. The number in the inner circle indicates the number of sequences analyzed for the individual denoted above the circle. Slices colored in shades of blue indicate cells that are clonally expanded (same IGHV and IGLV genes, with highly similar CDR3s). Pie slice size is proportional to the number of clonally related sequences. The black outline and % value indicate the frequency of clonally expanded sequences detected within an individual. White pie areas indicate the proportion of sequences isolated only once. For C005, there were no IgM transcripts amplified at the timepoint assayed.

