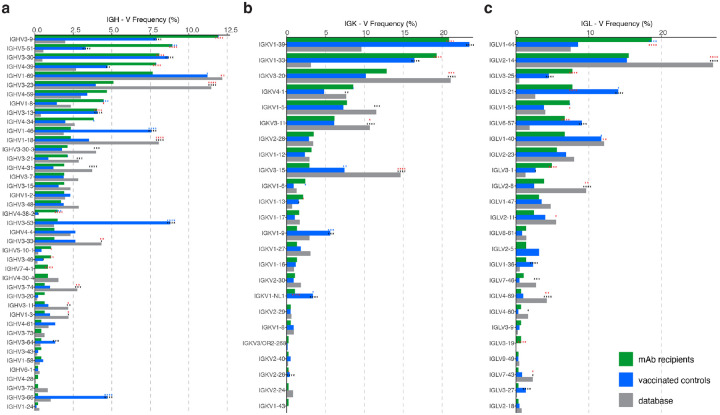
Extended Data Fig. 4: Frequency distribution of human V genes.
a-c, Comparison of the frequency distribution of V gene usage for the IgH and IgL among antibodies isolated from mRNA-vaccinated mAb recipients (this study) and controls10,11, after vax2, and from database of shared clonotypes of human antibodies from Soto et al35. Graphs show relative abundance of human IGHV (a), IGKV (b), and IGLV (c) genes within the human V gene database (in grey, Sequence Read Archive accession SRP010970), antibodies isolated from mAb recipients (in green) or vaccinated controls (in blue). Colors of stars indicate levels of statistical significance for the following frequency comparisons: black – vaccinated controls vs. database; red – mAb recipients vs. database; blue – mAb recipients vs. vaccinated controls.

