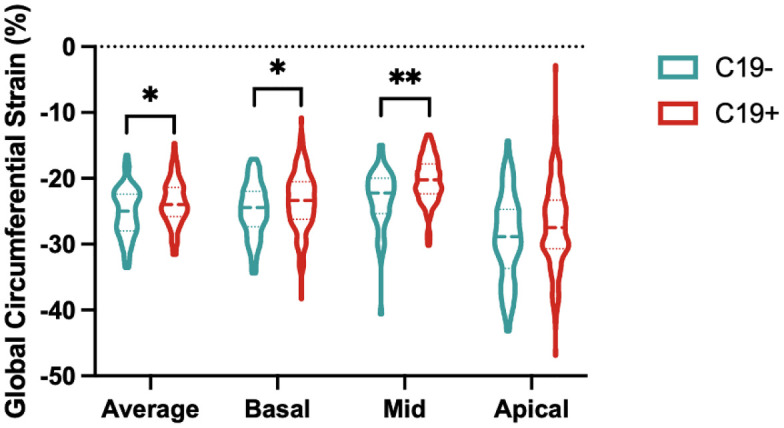
Figure 1.

Global circumferential strain comparison. Average global circumferential strain and from each section in athletic controls (C19-) and athletes after SARS-CoV-2 infection (C19+) are shown with dashed lines representing median and IQR. * p < .05 and ** p < .01 when compared by Wilcoxon rank-sum test.
