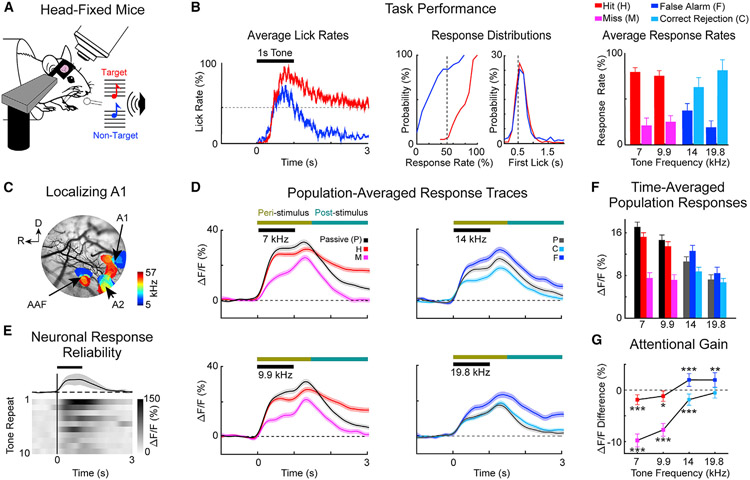
Figure 1. Two-photon imaging in awake-behaving mice shows neural responses modulated by behavioral choice.
(A) Head-fixed mice were trained to discriminate low-frequency target tones (red) versus high-frequency non-target tones (blue).
(B) Average lick rates within a trial during task performance (left panel). The horizontal black bar shows the tone presentation. The red trace and blue traces show the lick rate for hits (H) and false alarms (F), respectively. The dotted line illustrates chance performance, where licking is not timed to tone presentation, but rather it is evenly distributed across a given trial. Cumulative distribution functions across experiments for hit (red) and false alarm (blue) response rates and latencies (middle panels). Average behavioral choice rates, i.e., hit (red), miss (pink), false alarm (blue), and correct rejection (cyan), for each presented tone (right panel). Error bars show 2 SEM (n = 34 experiments).
(C) Primary auditory cortex (A1) was localized within a craniotomy by using widefield imaging to visualize tonotopy in auditory cortex.
(D) Average neuronal population response traces in A1 layer 2/3 (L2/3) (n = 2,792 neurons) color coded for behavioral choice as in (B). Each trace shows the response to the indicated tone. Shading shows 2 SEM. The horizontal colored bars show the peri- and post-stimulus windows, respectively, used for later analyses.
(E) Neurons in A1 L2/3 responded transiently, with jittered amplitude and timing in response to repeated identical tones.
(F) Neuronal response amplitude varied with both task performance and tone frequency. Error bars show 2 SEM.
(G) Attentional gain was defined as the difference between neural responses during behavioral versus passive trials for the same tone. Error bars show 2 SEM, and asterisks indicate statistically significant differences based on bootstrap t test (*p < 0.05, **p < 0.01, ***p < 0.001).

