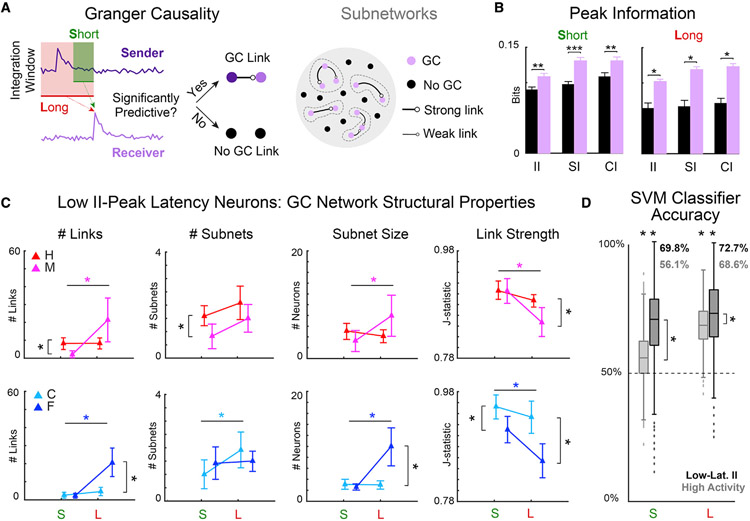
Figure 4. Behavioral choice was encoded in the network structure of low II-peak latency neurons.
(A) Functional networks of short (S)- and long (L)-timescale interactions among low II-peak latency neurons were estimated using Granger causality (GC) analysis for each behavioral choice: hit (H), miss (M), correct rejection (C), and false alarm (F). Disjoint sets of interlinked neurons constituted subnetworks (dashed gray boundaries).
(B) GC-linked neurons, for both S- and L-timescales, had more information than GC-unlinked neurons (*p < 0.05, **p < 0.01, ***p < 0.001).
(C) Four GC network statistics were analyzed: number of links, number of subnetworks, size of subnetworks, and statistical strength of links. Error bars show 2 SEM. Statistically significant differences, indicated by asterisks, were identified by Wilcoxon’s signed rank test (p < 0.05). See also Table S1.
(D) Network statistics were used to train a support vector machine (SVM) to classify behavioral responses into correct or incorrect decisions. Across timescale and selection of neurons, decisions were predicted significantly better than chance (p < 0.001). S-timescale network structure of low II-peak latency neurons was better decoded than highly responsive neurons (p < 0.001). L-timescale network structures had high decoding accuracy, but low II-peak latency networks were better decoded than highly responsive neurons (p < 0.001). Two-sample t tests (p < 0.05) were used to compare distributions and a one-sample t test (p < 0.05) to compare with chance performance.

