
FIGURE 2.
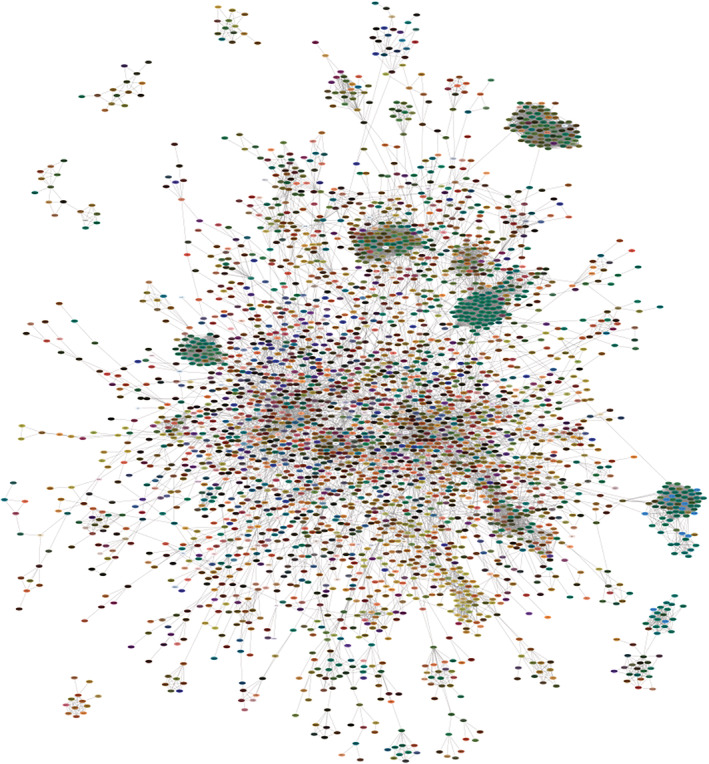
Color encoding the scRNA‐seq on physical protein complexes. To illustrate how U‐CIE can be used to visualize expression data on protein networks, we downloaded a published scRNA‐seq dataset with a read‐count matrix of 1,018 cells. 14 We applied U‐CIE to the transposed matrix (genes as columns, cells as rows), exported the colors, and visualized them on a physical protein–protein interaction network from the STRING database 7 (confidence cutoff 0.95) using Cytoscape. 8 In the figure, we show the six largest connected components. The network contains several large dark green clusters; these correspond to large complexes of housekeeping proteins, such as the cytosolic and mitochondrial ribosomes, the proteasome, and the electron transport chain complexes. The latter also contain some blue subunits, which are the proteins encoded by the mitochondrial genome. The less obvious cluster of tan nodes corresponds to core cell‐cycle proteins, including cyclin‐dependent protein kinases and the DNA replication complexes