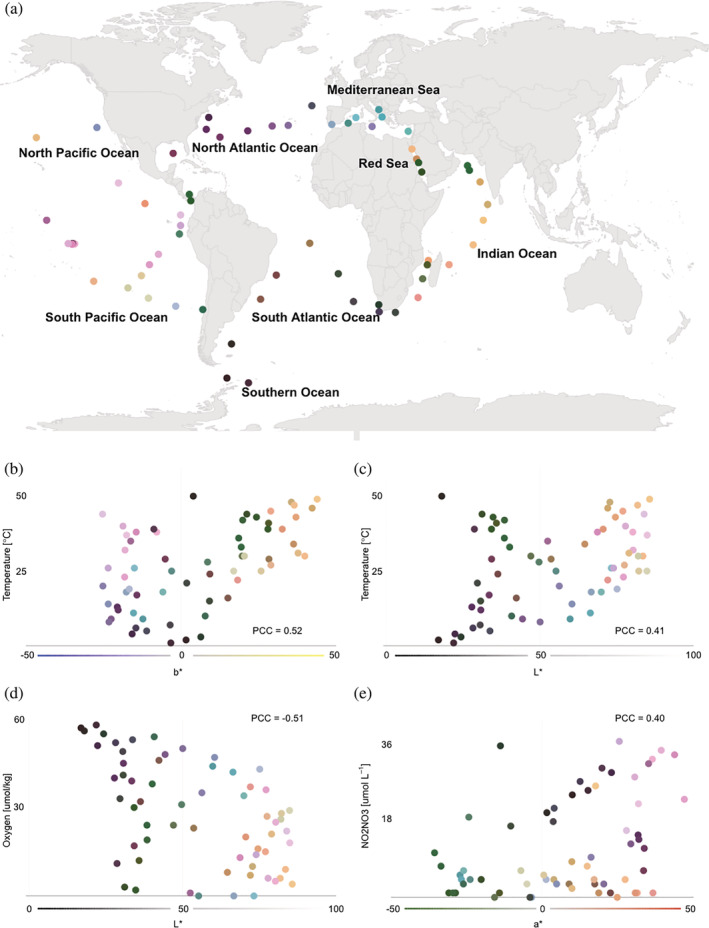
FIGURE 3.

Color encoding the microbiome compositions of ocean surface water samples. 16S rRNA microbiome composition of surface water samples from the Tara Oceans 15 sampling stations were encoded as colors using U‐CIE. The resulting colors were mapped onto the geographic locations of the sampling stations (panel a). The blue–yellow (b*) axis correlates with water temperature (panel b), the lightness (L*) correlates positively with temperature dissolved (panel c) and negatively with oxygen concentration (panel d), and the green–red axis (a*) correlates with dissolved nitrite/nitrate concentration (panel e)
