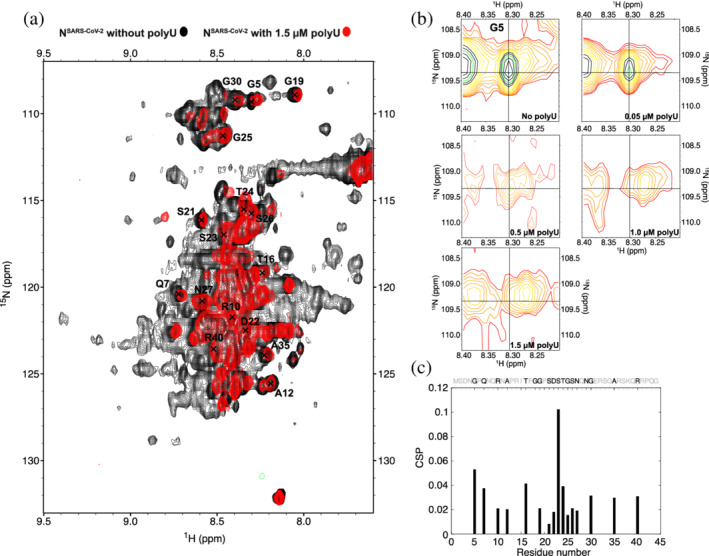
FIGURE 5.

RNA‐interaction of the N‐terminal intrinsically disordered region of NSARS‐CoV‐2. (a) Superposition of 1H‐15N HSQC spectra of full‐length NSARS‐CoV‐2 without polyU RNA and in the presence of 1.5 μM polyU. Spectra were measured at 5°C. (b) 1H‐15N HSQC spectra of the NSARS‐CoV‐2‐residue G5 in the presence of 0, 0.05, 0.5, 1.0, and 1.5 μM polyU RNA. (c) Chemical shift perturbation of the NTE upon interaction with 1.5 μM polyU RNA (NTE sequence shown above; unassigned/overlapped residues are displayed in light gray)
