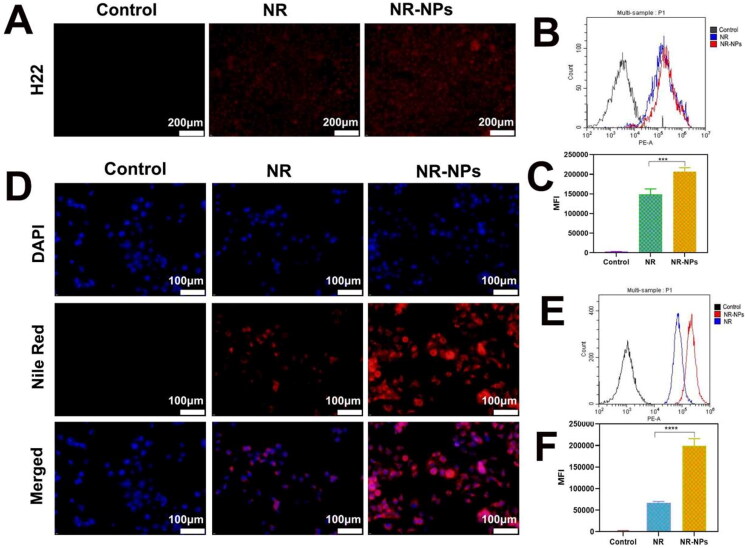
Figure 2.
The uptake of free Nile Red and Nile Red-NPs by H22 and Huh7 cells. The fluorescence microscopy microscopic images of NR(nile red) and NR-NPs uptake by H22 cells(A) and Huh7 cells(D). Flow cytometry analysis of NR (nile red) and NR-NPs uptake by H22 cells(B) and Huh7 cells(E) and (C), (F) The relative mean fluorescence intensity (MFI) corresponding to flow cytometry analysis. Results are mean ± SD of three replicates (ns: no statistical significance,*P < 0.05, **P < 0.01, ***P < 0.001,****P < 0.0001).

